
More Information
Submitted: April 11, 2024 | Approved: April 24, 2024 | Published: April 25, 2024
How to cite this article: Alpaydin SG, Yukselen-Aksoy Y. Evaluation of Soil Water Characteristic Curves of Boron added Sand-bentonite Mixtures using the Evaporation Technique. Ann Civil Environ Eng. 2024; 8: 025-031.
DOI: 10.29328/journal.acee.1001062
Copyright License: © 2024 Alpaydin SG, et al. This is an open access article distributed under the Creative Commons Attribution License, which permits unrestricted use, distribution, and reproduction in any medium, provided the original work is properly cited.
Keywords: HYPROP; SWCC; Sand-bentonite; Boron; Van genuchten

Evaluation of Soil Water Characteristic Curves of Boron added Sand-bentonite Mixtures using the Evaporation Technique
Sukran Gizem Alpaydin1* and Yeliz Yukselen-Aksoy2
1PhD. Candidate, The Graduate School of Natural and Applied Sciences, Dokuz Eylul University, Izmir 35390, Turkey
2Professor, Department of Civil Engineering, Dokuz Eylul University, Izmir 35390, Turkey
*Address for Correspondence: Sukran Gizem Alpaydin, PhD. Candidate, The Graduate School of Natural and Applied Sciences, Dokuz Eylul University, Izmir 35390, Turkey, Email: [email protected]
Compacted bentonite or sand-bentonite mixtures are considered buffer/backfill materials in the engineering barriers of deep geological repositories for high-level nuclear waste (HLW) disposal in many countries. The design and long-term functionality of nuclear repositories have critical importance for environmental safety and public health. The initially unsaturated buffer material could become re-saturated long after following the sealing of the repository. Although the saturation degree of the buffer might decrease due to high temperatures and evaporation, it tends to increase with groundwater intrusion. Therefore, the soil water characteristic curves (SWCCs) for these unsaturated soils are a key factor in geotechnical engineering. Yet, the determination of SWCCs can be time-consuming and prone to inaccuracies. The HYPROP (Hydraulic Property Analyzer) evaporation technique is a preferred method for accurately determining water retention curves of soils. This reliable method was applied to estimate the water retention curves for sand-bentonite mixtures in the presence of boron minerals. Known for their minimal thermal expansion and commonly used in various industries, boron minerals may improve the thermal stability of sand-bentonite mixtures. The findings revealed that the boron addition increased the water retention capacity of the 10% bentonite mixtures but had a negligible impact on the 20% bentonite mixtures.
In the design of deep geological repositories for safely storing high-level radioactive waste, an engineered sealing barrier is crucial. This barrier is strategically placed between the waste canisters and the host rock to effectively slow radionuclide migration, prevent flow path development towards the host rock, and enhance the structural integrity of the tunnel. Compacted bentonite or bentonite-sand mixtures are favored as sealing materials due to their low permeability, ability to swell, and high retention qualities. Initially, compacted bentonite or sand-bentonite buffers are in a dry state due to the decay heat released from the disposal canister. However, over several centuries, the buffer would become almost fully saturated as a result of groundwater penetration [1,2]. For that reason, compacted buffers are exposed to volume changes and swelling tendencies in actual repository environments [3]. Once positioned in the deposition holes or tunnels of a deep geological repository, bentonites will slowly saturate from water absorbed from the host rock but will stay unsaturated for extended periods, especially near the heat-dissipating waste containers [4]. While in contact with the canister, the bentonite is initially subjected to significant heat, potentially reaching up to 150 °C in the early phases post-disposal. Concurrently, the bentonite begins to hydrate, absorbing moisture from the bedrock. This process causes the outer layers of the bentonite to swell, exerting pressure on the inner layers, which in turn experience contraction due to the rise in suction induced by the temperature increase. To accurately predict the behavior of bentonite in these conditions, it’s essential to understand its reaction to the relevant stresses, variations in water saturation, and temperature fluctuations [5]. Therefore, the measurement of suction is crucial for investigating groundwater movement in unsaturated compacted bentonite.
Additionally, modeling water movement based on these results is necessary to comprehend both the re-saturation and the thermo-hydro-mechanical behavior of the bentonite buffer in a high-level radioactive waste repository. In recent years, the engineering behavior of several types of soils under unsaturated conditions has been interpreted by considering the effect of suction [6-10]. Water retention behavior, which describes the constitutive relation between the soil hydraulic state (relative humidity, suction, water potential, or water activity) and the amount of pore water (water content or degree of saturation), is of great importance in understanding the hydro-mechanical behavior of unsaturated soils.
The water retention characteristics of bentonite are crucial for evaluating its performance as a barrier material, as these characteristics significantly impact its hydraulic and thermal conductivity, as well as effective stress. Therefore, the time required to reach equilibrium and the final distribution of dry density also depends on the water retention curve. There's a clear link between the hydraulic and mechanical responses of bentonite. This is observed in the generation of high swelling pressure under confined wetting conditions or significant swelling deformations when wetting occurs without kinematic restrictions. The water retention properties of bentonite are largely influenced by dry density and the compressibility of bentonite is similarly affected by the level of suction it experiences.
There are three widely recognized suction-controlled techniques: The first well-known suction-controlled technique is the axis translation technique, which is effective for suctions up to 14 MPa. This method is based on the use of ceramic porous stones, allowing the separate application of air and water pressure [11]. The second technique, known as the osmotic technique, is applicable for suctions up to 12 MPa. It involves the use of PEG (polyethylene glycol) solutions [12]. The other technique, the vapor equilibrium technique, is suitable for suctions ranging from 3 MPa to 1000 MPa. Thus, the vapor equilibrium technique provides a significant advantage for measuring high suction levels in unsaturated bentonite-sand mixture specimens. This method is based on the utilization of salt solutions [13,14]. An increasingly popular version of the evaporation method is the HYPROP measurement system. This system enables semi-automated direct measurements of water retention and conductivity pairs across a relatively wide range of pressure head values.
Seiphoori, et al. [15] conducted a study on the water retention behavior of granular MX80 bentonite. Their findings showed notable deviations from the initial wetting path upon re-drying after saturation. Additionally, the second wetting cycle did not align with the first, indicating alterations in the clay structure post-saturation. The SWCC for FEBEX bentonite samples was measured under different temperatures both in confined and unconfined conditions using the Vapor Equilibrium Technique (VET) in a desiccator [3]. It was found that at 20 °C, the water retention of compacted bentonite was higher than at 80 °C for both confined and unconfined conditions. This study also noted that the water retention ability of bentonite was greatly influenced by boundary conditions with unconfined samples showing higher water retention. Additionally, the results revealed that water retention capacity decreased with increasing temperature, particularly at lower suctions. At suctions higher than 100 MPa, volume changes were small and not dependent on temperature.
Zhang, et al. [16] noted a decrease in water retention characteristics with higher sand content in saturated GMZ bentonite-sand mixtures, without considering the impact of temperature and sand grain size on the soil water characteristics curve. As the clay content in sand-clay mixtures increases, the soil water characteristic curve (SWCC) transitions from a unimodal to a bimodal structure. Additionally, both the air-entry value and residual water content increase with the clay content, indicating an enhancement in water retention capacity [17]. Yao, et al. [18] investigated the water retention characteristics of unsaturated bentonite-sand mixtures (BSMs) using the vapor equilibrium technique. The research assessed these mixtures, focusing on the impacts of sand grain size, temperature, and sand content on the soil water characteristic curves (SWCCs). The findings revealed that quartz sand grain size has minimal impact on water adsorption and retention, particularly at high suctions. It was also observed that in bentonite, water retention is predominantly controlled by adsorption. Temperature increases lead to a decrease in water content due to a balance between reduced adsorption and enhanced evaporation.
Bentonite has a high water retention capacity due to its high activity. However, when bentonite is mixed with sand, its water retention capacity decreases. In addition, the engineering properties of sand-bentonite mixtures change due to high-temperature effects in disposal areas. Therefore, boron minerals, which have very low thermal expansion, may be added to sand-bentonite mixtures. Colemanite, tincal, and ulexite a widely used boron minerals in industry. Its significance extends to the production of heat-resistant glassware and high-quality glasses crucial for applications in electronics and space exploration. Additionally, it imparts resilience to external stressors such as vibration, high temperatures, and heat shock [19].
This study focuses on investigating the suction characteristics of sand-bentonite mixtures. The suction behavior of sand-bentonite mixtures was also investigated in the presence of colemanite, and tincal addition. The research conducted suction tests on these mixtures using the Hyprop system. To interpret the suction measurements, the obtained data were fitted using the Van Genuchten model [20].
Commercial sand, Na-bentonite, and their mixtures with boron minerals (i.e. colemanite, and tincal) are used to determine their suction characteristics by using the HYPROP system. The boron minerals were obtained from the Eti Mining Operations General Directorate in Turkey. The grain size distribution curves of sand and bentonite are depicted in Figure 1. Figure 2 also shows the grain size distribution curves of boron minerals. Based on these distributions, the sand contains 1.6% fine material. The clay content value of bentonite was 82.0%. The sand and bentonite were classified as well-graded sand (SW) and clay of high plasticity (CH), respectively according to the Unified Soil Classification System (USCS) [21].
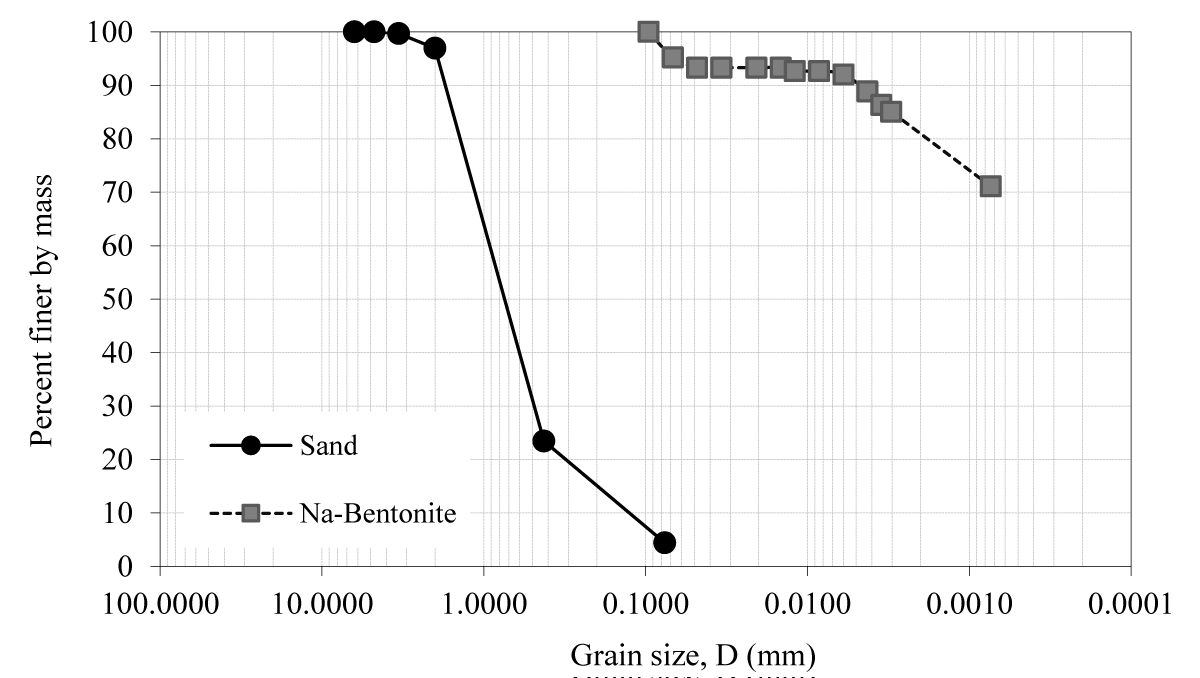
Figure 1: Grain size distribution of sand and Na-bentonite.
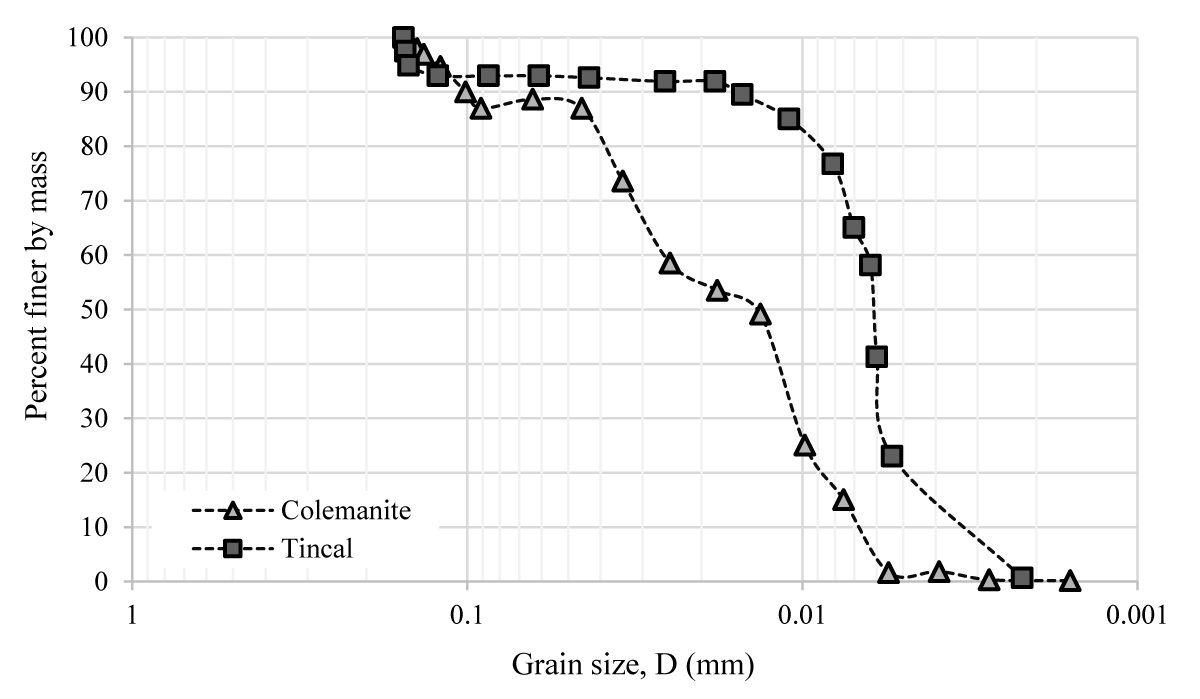
Figure 2: Grain size distribution of colemanite, and tincal.
In all experiments, Na-bentonite and sand were oven-dried for 24 h at 105 °C before use. The sand and Na-bentonite were used by sieving through a No.6 (3.35 mm) and a No.200 (0.075 mm) sieve, respectively after drying. The boron minerals were also used in their inherent water content as their structure change with temperature. The inherent water contents of the boron minerals were determined at the beginning of each test and considered during sample preparation. Tincal, on the other hand, was crushed using a jaw crusher and then sieved through a No.40 (0.425 mm) for the tests. Since colemanite was supplied in powder form (0.075 mm), colemanite was used without any crushing and sieving processes. The physicochemical properties of sand, bentonite, and boron minerals are given in Table 1.
| Table 1: Physico-chemical properties of bentonite, sand, and boron minerals samples. | ||||
| Property | Sand | Bentonite | Colemanite | Tincal |
| Specific Gravity | 2.63 | 2.70 | 2.44 | 1.67 |
| Liquid Limit (%) | - | 476 | 37 | 61 |
| Plastic Limit (%) | - | 70 | 26 | 43 |
| Plasticity Index (%) | - | 406 | 11 | 18 |
| Inherent water content (%) | - | 8-12 | 1-3 | 7-9 |
| pH | - | 9.50 | 9.26 | 9.12 |
| No. 200 (%) | 1.64 | 100 | 100 | 91.3 |
Boron constituted 10% or 20% of the total dry weight in the samples, with the remaining portion composed of bentonite and sand. The sand-bentonite mixtures (bentonite/bentonite-sand) with a ratio of 0.1 and 0.2 on a dry weight basis were prepared homogeneously. The names of the mixtures were abbreviated using the initial letters of their components (i.e., "B" for bentonite, "S" for sand, and "C" for colemanite, etc.) and their proportions in the mixture. For instance, a mixture labeled 16B-64S-20C contained 16% bentonite, 64% sand, and 20% colemanite.
The soil-water characteristic curves (SWCCs) of 10% and 20% additive-free sand-bentonite mixtures, as well as sand-bentonite mixtures in the presence of boron (colemanite, and tincal) addition (10% and 20%), were evaluated. The HYPROP (Hydraulic Property Analyzer) was used to obtain the SWCCs.
The HYPROP system operates on an evaporation method, employing two tensiometers to measure the tension implied by water on the soil column. These tensiometers (i.e., one short and one long) measure the water potential at various degrees of soil saturation. The tensiometers were strategically positioned so that the midpoint of the soil sample (2.5 cm) aligns centrally between the tips of the tensiometers, placed at 1.25 cm and 3.75 cm respectively.
During the HYPROP experiment, the soil sample is placed on a lab balance, and as the experiment progresses, water gradually evaporates from the soil surface. HYPROP meticulously records the changes in water potential during this process, as well as the concurrent changes in the weight of the soil sample. These weight changes are crucial for determining the moisture content of the soil. The data collected, pressure heads, water contents, and rates of evaporation, are then used to estimate the Soil Water Retention Capacity (SWRC) and its unsaturated hydraulic conductivity functions [22]. Finally, HYPROP-Fit software plots water potential against the variations in moisture contents to generate a SWCC.
The mixtures were compacted in stainless-steel cylinders (Figure 3) (approximately 250 cm3 with an inside diameter of 8 cm and a height of 5 cm) according to Standard Proctor parameters (Table 2). More specifically, the dry powdered materials were first thoroughly mixed. Subsequently, tap water was added at the pre-determined optimum water content and mixed until the mixture became homogeneous. Afterward, the mixture was compacted in the special mold with the help of a hammer in three layers, achieving the predetermined maximum dry unit weight values. The prepared samples were placed in the clamped system, sandwiched between two porous stones to prevent swelling, and then kept submerged condition to get saturation.
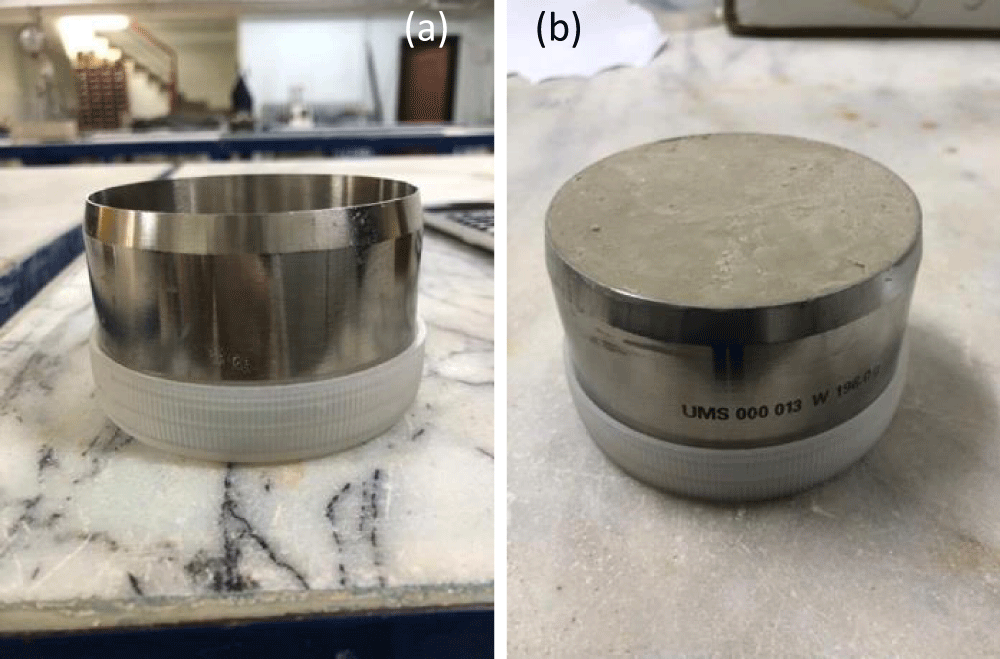
Figure 3: a) HYPROP special mold b) compacted sample in the mold.
| Table 2: The compaction parameters of mixtures. | ||
| Mixture | gd,max (kN/m3) | wopt (%) |
| 10B-90S | 16.2 | 16.5 |
| 9B-81S-10C | 16.6 | 15.5 |
| 8B-72S-20C | 16.7 | 12.0 |
| 9B-81S-10T | 16.2 | 18.5 |
| 8B-72S-20T | 15.6 | 19.5 |
| 20B-80S | 15.9 | 16.8 |
| 18B-72S-10C | 16.3 | 14.5 |
| 16B-64S-20C | 15.9 | 18.5 |
| 18B-72S-10T | 15.8 | 18.5 |
| 16B-64S-20T | 15.0 | 23.0 |
The tests were started when the sample got saturation (Figure 4). Using a small auger, two holes were drilled to fit two vertically aligned tensiometers, set up for the best performance of the evaporation method. The testing period for each sample typically ranged from 7 to 14 days. After data collection, the data were analyzed to construct the SWCC, correlating the average soil water content (determined from the weight of the sample) with the average soil matric potential (measured by the tensiometers at two depths). The analysis was based on the assumption that both a linear distribution of soil matric potential and water content throughout the soil column, and consistent changes in weight and water tension between any two points of assessment [22].
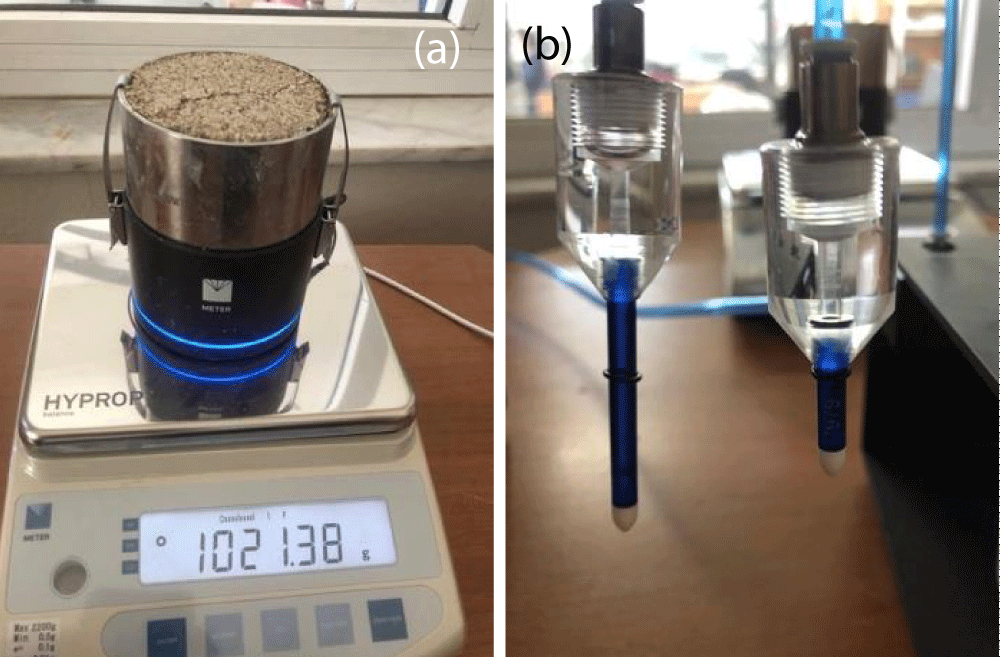
Figure 4: HYPROP device: a) measuring sample weight, b) long and short tensiometers to measure water.
The HYPROP-Fit software can identify both the balance and measuring heads, automatically assigning measured values to tensions. As the sample undergoes the drying process, the instrument measures the changing water potential and the changing sample weight simultaneously. By calculating moisture content from weight measurements, the software generates plots illustrating the correlation between changes in water potential and moisture content variations over time. Additionally, the HYPROP-Fit program offers a selection of analytical models to interpret HYPROP data. In this study, the most widely used Van Genuchten model was selected. The van Genuchten model (1980) is one of the most widely used models for soil water characteristic curves (SWCC). It applies to a broad spectrum of soil types, ranging from fine-grained to coarse-grained. This model utilizes porous structures to simulate flow paths in unsaturated media and is known for its adaptability in modeling both disturbed and undisturbed soils. The van Genuchten model shows significant variability in its residual results, as its algorithm is prescribed for small matric suction ranges and does not consider transitions between various porous systems. It assumes a saturated moisture capacity of zero and defines the retention curve intersection angle at 90°. The model is typically applied using a least squares method to fit adjustable curve-fitting parameters. The van Genuchten function is preferred due to its widespread application in θ(h)–C(h) modeling. Additionally, the van Genuchten soil water retention curve is characterized by its smoothness, and the related relative hydraulic conductivity function is expressed in a closed form, enhancing its practical utility.
The soil water characteristic curves (SWCCs) of additive-free and boron (i.e. colemanite, and tincal) added sand-bentonite mixtures were determined by the HYPROP (Hydraulic Property Analyzer) device. The HYPROP-Fit software provided a platform for selecting appropriate models to interpret the collected data. This research adopted the Van Genuchten model, a predominant model for such analyses, to examine the SWCCs. Accordingly, the determined SWCCs for 10B-90S and 20B-80S mixtures, as fitted using this model, are presented in Figure 5.
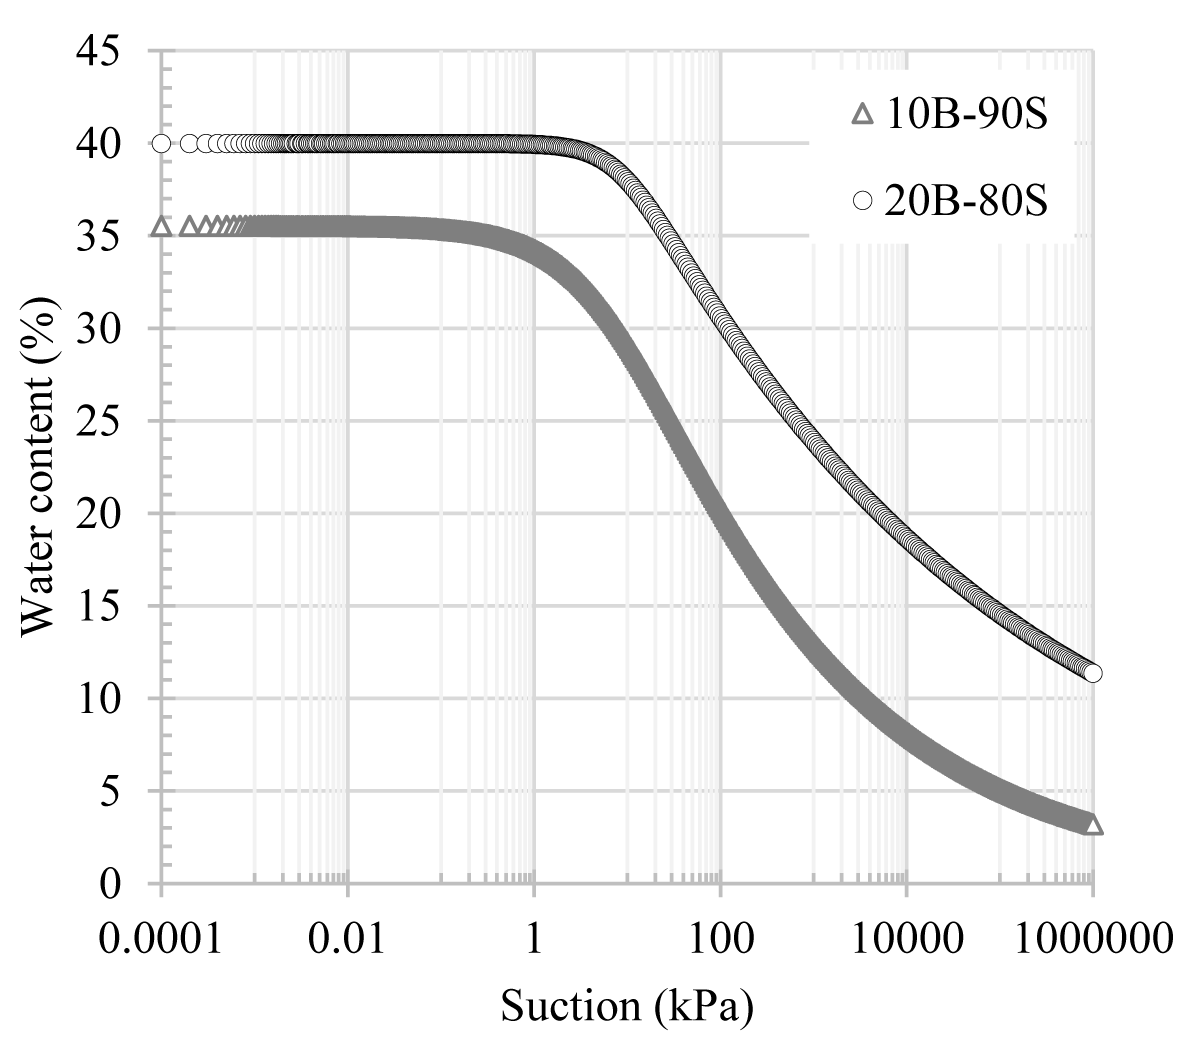
Figure 5: SWCCs of sand-bentonite mixtures.
Accordingly, the water contents of these mixtures at a suction value of 1000 MPa were determined as 3.2% and 11.4%, respectively. It was observed that the 20B-80S mixture consistently exhibited higher suction values compared to the 10B-90S mixture at the same water content, indicating that suction values increased with an increase in bentonite content. This trend was more notable at lower water content values. For example, at a water content of 30%, the 10B-90S had a suction value of around 8 kPa, whereas the suction value of 20B-80S significantly increased to 120 kPa.
Surface tension is a crucial factor influencing water retention capacity. With an increase in the bentonite content within the mixture, there was a corresponding increase in the suction value. Agus, et al. [23] noted that the total suction values of bentonite-sand mixtures were primarily a function of bentonite content. Bentonite minerals have surface electrical charges. Therefore, as the bentonite content increased in the mixture, the surface electric charge of the particles also increased, a phenomenon linked to the large specific surface area of bentonite. Consequently, a mixture containing a higher bentonite content is expected to have greater osmotic and sorptive forces at the same water content [24]. Figure 6 shows the SWCCs of sand-bentonite mixtures with 10% and 20% additions of colemanite.
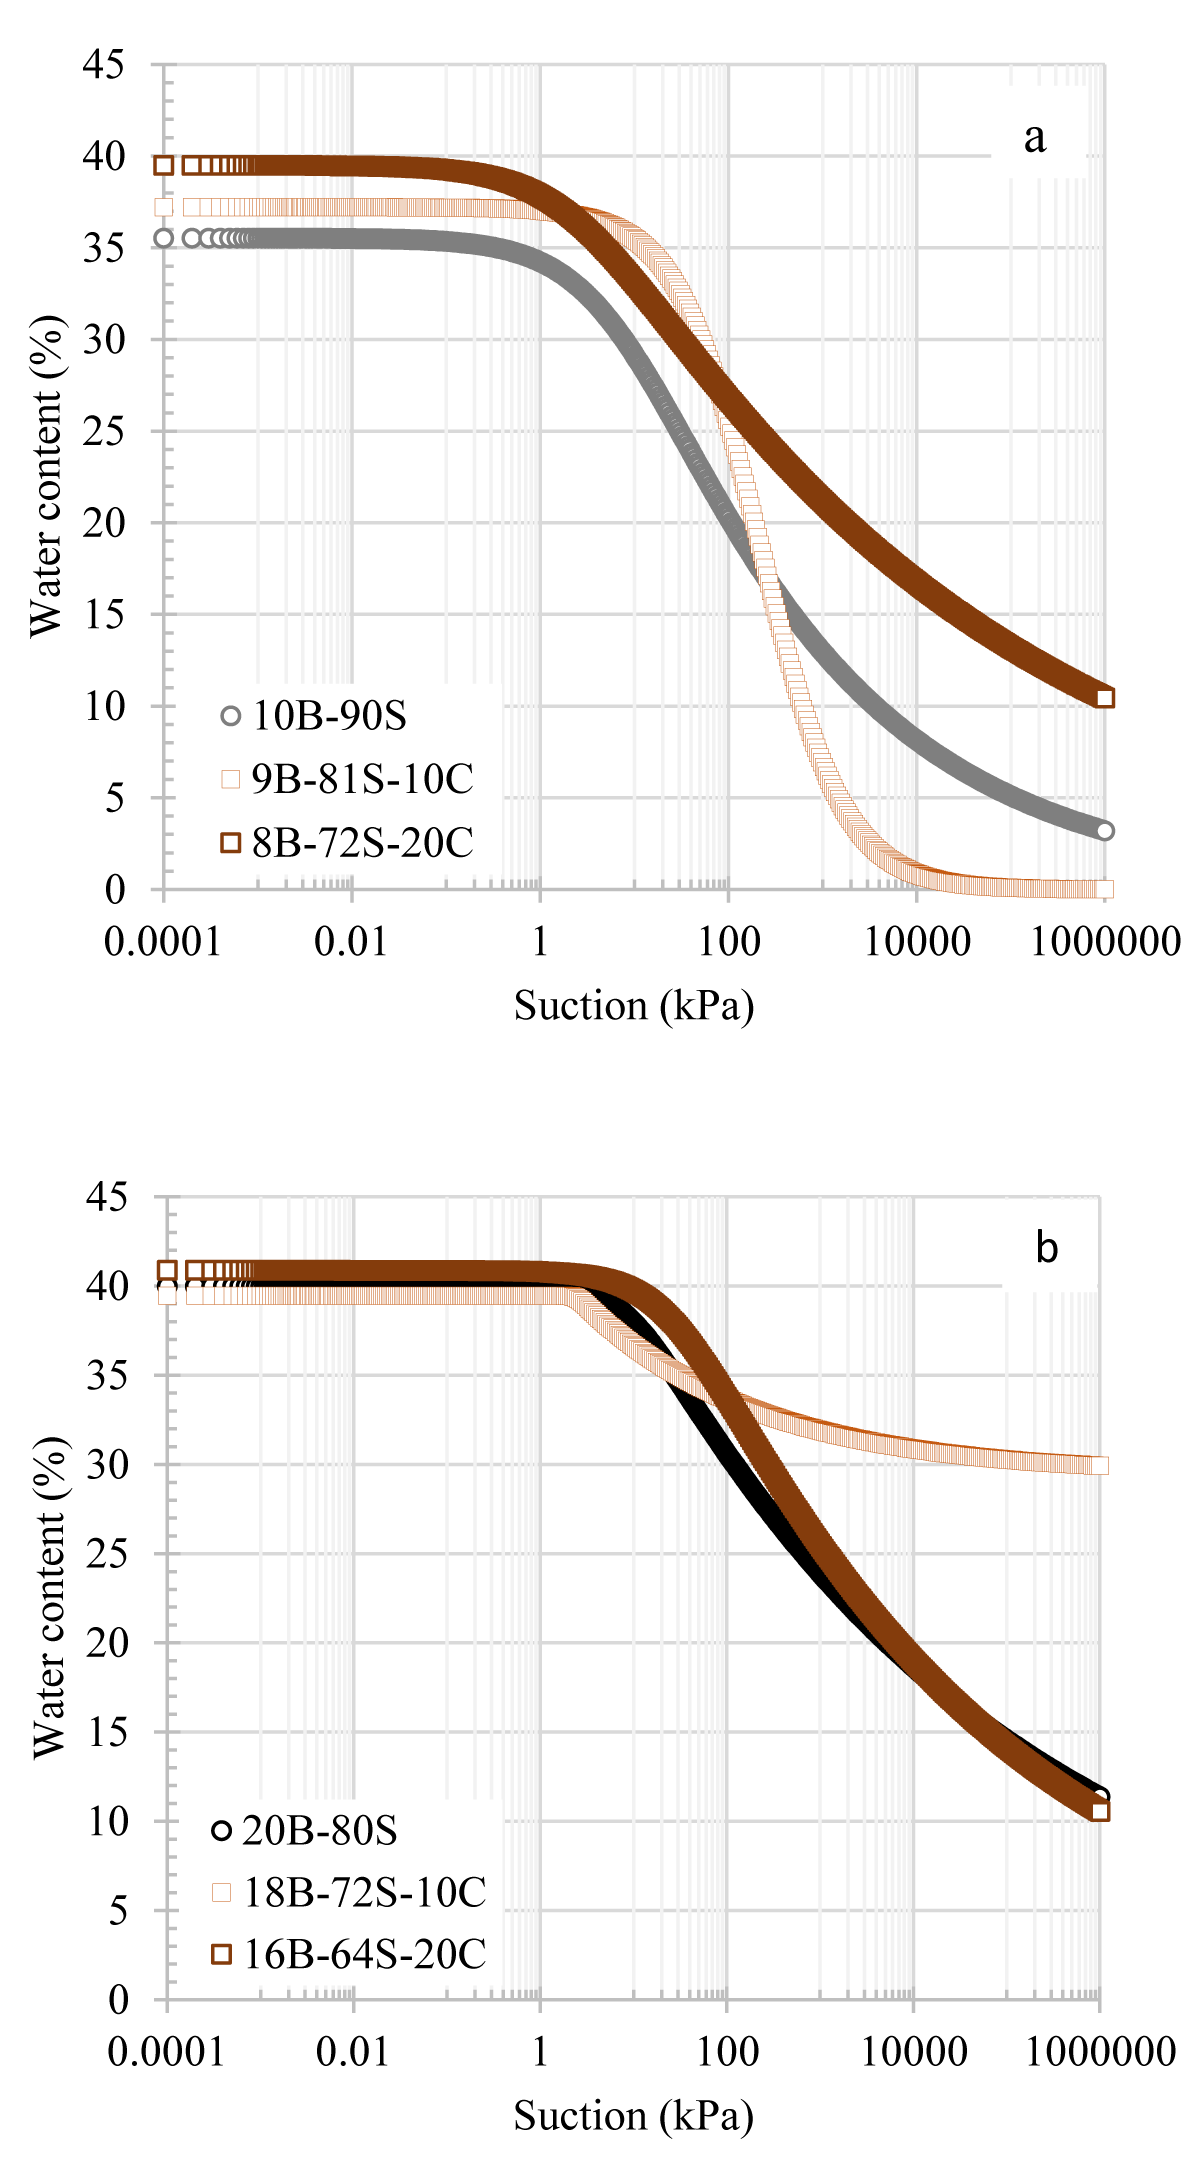
Figure 6: SWCCs of sand-bentonite mixtures in the presence of colemanite additives a) 10B-90S, b) 20B-80S mixtures.
For the 10B-90S mixture, there was a notable increase in water retention capacity with the addition of colemanite, as shown in Figure 6a. For example, while the suction value of 10B-90S was 8 kPa at 30% content, it increased to 30 kPa and 36 kPa with the addition of 10% and 20% colemanite, respectively. This increment was valid up to 17% water content. Below this level, the water retention curve for the 9B-81S-10C mixture became similar to that of the additive-free mixture. On the other hand, the 8B-72S-20C mixture showed a more pronounced increase in water retention capacity. In the case of the SWCCs for mixtures containing 20% bentonite, the addition of colemanite did not impact the water retention capacity up to 35% water content, as illustrated in Figure 6b. Figure 7 presents the SWCCs for sand-bentonite mixtures with the addition of tincal. Similar to the effect of colemanite, tincal also increased the water retention capacity of the 10% bentonite mixtures. With the addition of tincal, the suction values reached around 170 kPa at 30% water content. For the 10B-90S mixtures, tincal increased the suction value more compared to colemanite. The effect of tincal on 20% bentonite mixtures had no clear trend. It was observed that for mixtures with 20% bentonite, adding 10% tincal decreased the water retention capacity, while the addition of 20% tincal increased.
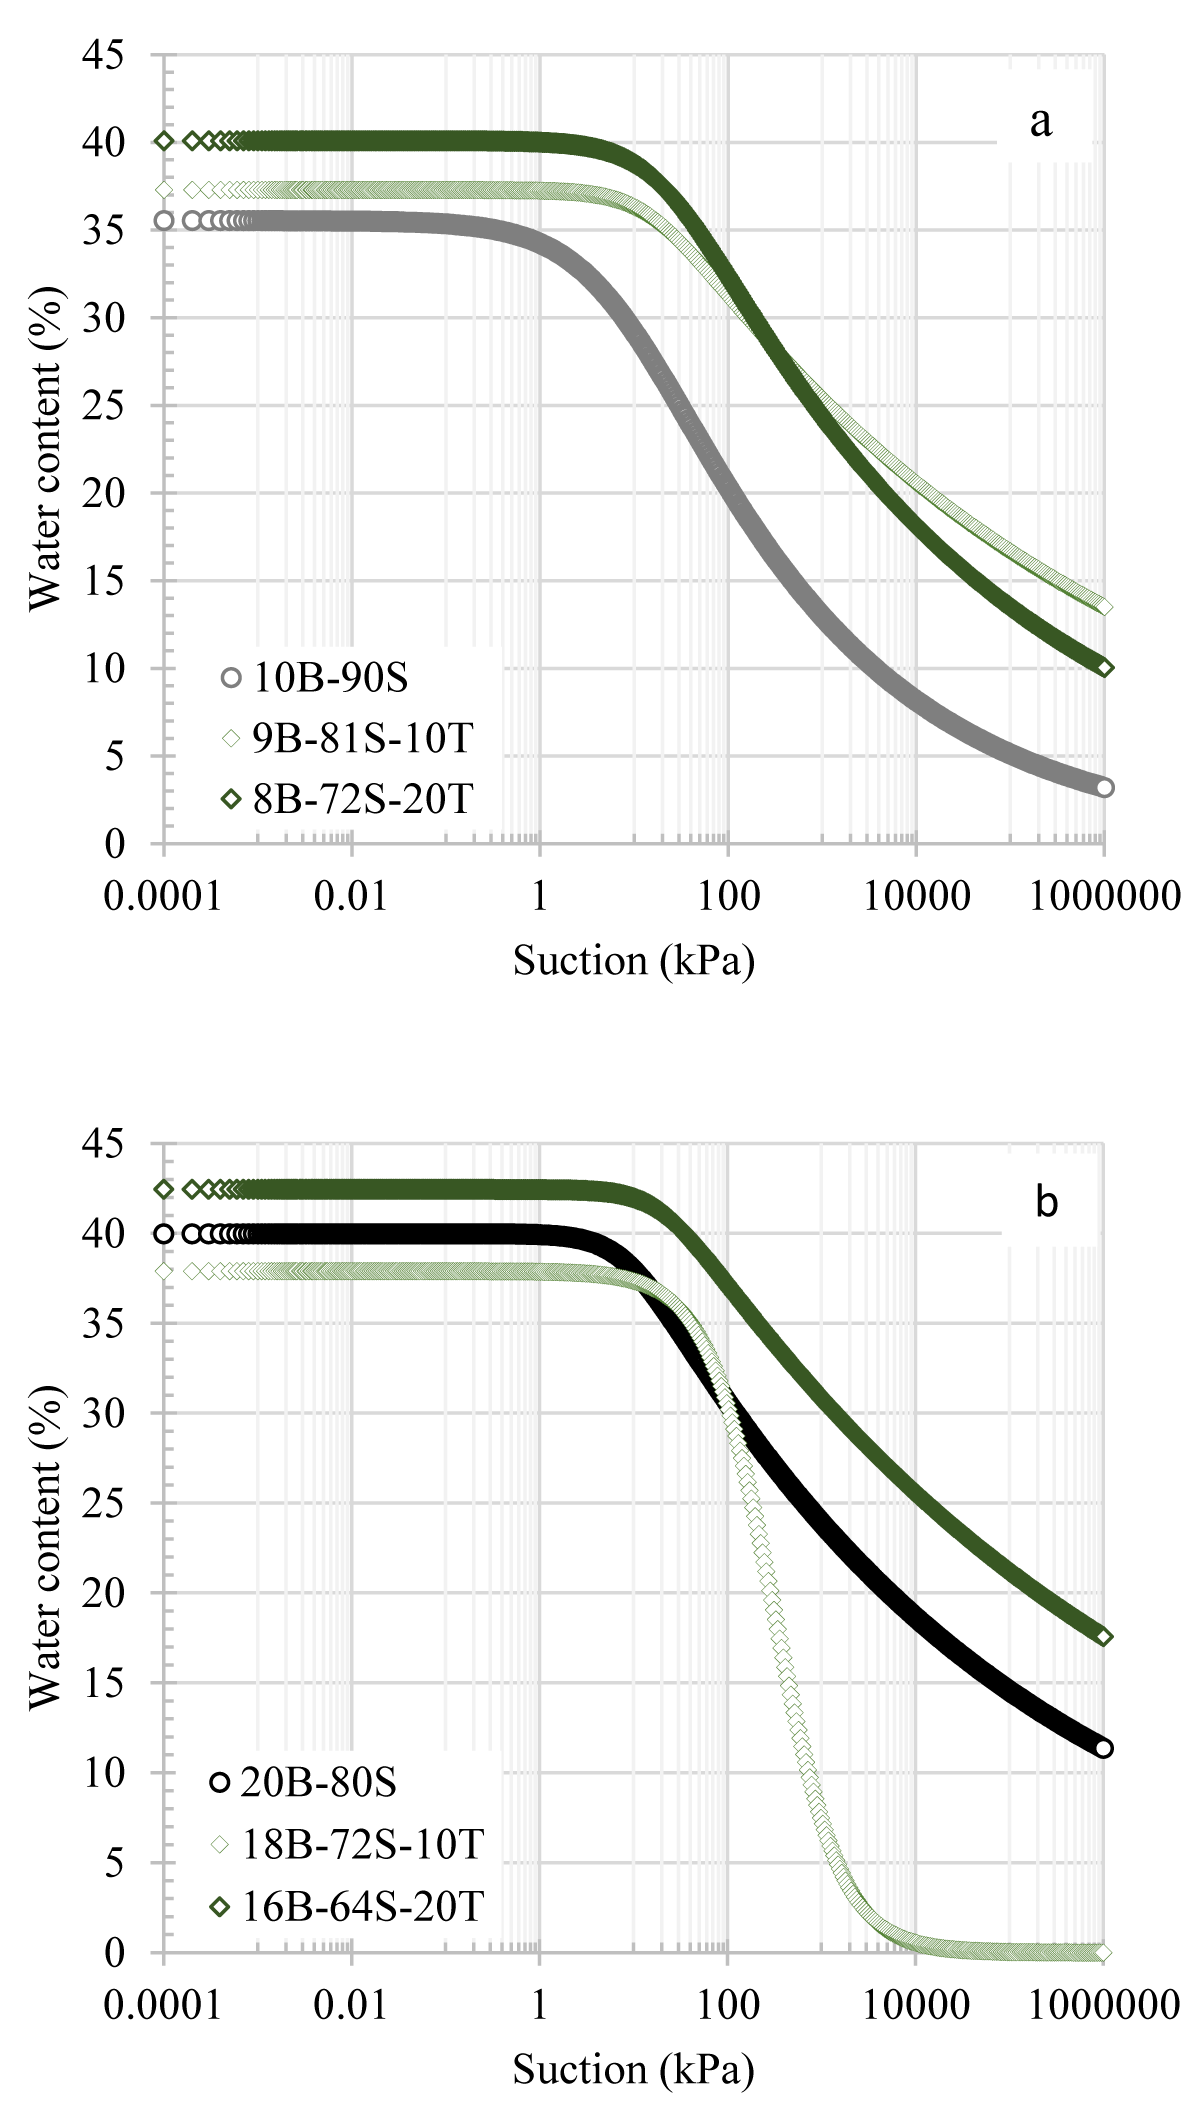
Figure 7: SWCCs of sand-bentonite mixtures in the presence of tincal additives a) 10B-90S, b) 20B-80S mixtures.
In general, the SWCCs of the 10B-90S in the presence of colemanite, and tincal additives were above the SWCC of the additive-free 10B-90S mixture. In addition, the difference between the suction values of the samples decreased with the increase in water content. The reason for this may be that as the bentonite content increased, the more dominant variable affecting the water retention capacity was the amount of bentonite. It was expected that the water retention capacity would increase when boron minerals, which have a higher specific surface area than sand, were added to the mixture at lower bentonite contents. However, in sand-bentonite mixtures containing 20% bentonite, the mixture behaved like bentonite since bentonite filled all the voids and the effect of the added boron minerals became insignificant. This phenomenon can be attributed to the bentonite having a higher specific surface area than both boron and sand and has become dominant in the mixture.
The change in water content in bentonite is predominantly linked to the variations in the volume of water in the intergranular and intragranular pores. Surface tension is a critical factor influencing the water absorption capacity of soils. Bentonite minerals have electric charges on their surfaces. As the bentonite content in the mixture increases, the surface electric charge of the particles increases due to the high specific surface area of bentonite. Consequently, mixtures with higher bentonite contents are expected to have greater osmotic and suction forces at the same water content [24]. The addition of boron minerals leads to a reduction in water retention capacity because it decreases the relative amount of bentonite. It should also be noted that a soil sample, despite having the same structure and mineralogy, may not have the same water retention capacity due to differences in initial water content, void ratio, stress history, and compression energy [25-27]. As the soil transitions to drier conditions, the redistribution of soil, water, and air phases changes since the stress state changes. The moisture interaction zone between soil particles decreases with the increase in soil suction pressure [28, 29].
In the present study, the suction behavior of additive-free sand-bentonite mixtures was investigated. Additionally, the effect of boron additive on the suction behavior of sand-bentonite mixtures was also examined. The results reveal several key findings. Firstly, an increase in suction values was linked to higher bentonite content, and this effect was more pronounced at lower water contents. Additionally, the addition of boron improved the water retention capacity in mixtures containing 10% bentonite, while it had no significant impact on mixtures with 20% bentonite. These results contribute to a better understanding of how bentonite content and boron additives affect the water retention properties of sand-bentonite mixtures.
This study is supported by The Scientific and Technological Research Council of Turkey (TUBITAK) (Grant no: 120M470). The authors are grateful for this support. The authors would like to thank 100/2000 The Council of Higher Education (YÖK) scholarship.
- Rahman A, Islam M, Ahmed F. Physico-chemical and bacteriological analysis of drinking tube-well water from some primary schools, Magura, Bangladesh to evaluate suitability for students. International Journal of Applied Sciences and Engineering Research. 2015; 4: 5.
- Murray CJ, Lopez AD. Alternative projections of mortality and disability by cause 1990-2020: Global Burden of Disease Study. Lancet. 1997 May 24;349(9064):1498-504. doi: 10.1016/S0140-6736(96)07492-2. PMID: 9167458.
- Rout C, Sharma A. Assessment of drinking water quality: A case study of Ambala cantonment area, Haryana, India. International Journal of Environmental Sciences. 2011; 2: 2.
- LaSota DE, Bidlack TW, Evans JW. Laboratory Manual for the Microbiological Analyses of Public Drinking Water. OhioEEPA. 2001.
- Mohammed FAl, Mutasher A. Application of Water Quality Index for Evaluation of Groundwater Quality for Drinking Purpose in Dibdiba Aquifer, Kerbala City, Iraq. Journal of Babylon University/Engineering Sciences. International Conference on Water and the Environment: Development Issues for the 2lst century. 1992, Dublin, Ireland. 2013. 5:21.
- Yves L. editor. WHO, author. Minimizing potential for changes in microbial quality of treated water. London, UK: IWA Publishing. 2004.
- Kwame MM. Assessment of Drining water Quality in EHI Community in the Ketu- North District of the Volta Region of Ghana. Department of Theoretical and Applied Biology, Kwame Nkrumah University of Science and Technology, Kumasi, Ghana in Partial Fulfillment of the Requirements for The Degree of Master of Environmental Science. 2011.
- Meybeck M, Helmer R. Introduction in: Water Quality Assessments. A Guide to the Use of Biota, Sediments and Water in Environmental Monitoring. 2nd edition. Chapman & Hall, London. 1996.
- Mohsin M, Safdar S, Asghar F, Jamal F. Assessment of Drinking Water Quality and its Impact on Residents Health in Bahawalpur City. International Journal of Humanities and Social Science. 2013; 3: 15.
- Haydar CM, Tarawneh K, Nehme N, Amaireh M, Yaacoub A, Diab W. Heavy metals content in water and sediments in the upper Litani River Basin, Lebanon Journal of Geoscience and Environment Protection. 2022; 10: 7; 139-158.
- C Haydar, N Nehme, S Awad, B Koubayssi, M Fakih, A Yaacoub, Physiochemical and microbial assessment of water quality in the Upper Litani River Basin, Lebanon, J Environ Earth Sci. 2014; 4 (9): 87-97.
- Nehme N, Haydar C, Koubaissy B, Fakih M, Awad S, Toufaily J, Villieras F, Hamieh T. Metal concentrations in river water and bed sediments of the Lower Litani River.2014.
- Nehme N, Haidar CM, Dib A, Azouj N, Tarawneh K. Quality Assessment of Groundwater in the lower Litani Bassin (LLRB), Lebanon. Geosciences Research. 2020; 5: 1.
- Nehme N, Haidar CM, Diab W, Tarawneh K, Villieras F. 2019Assessment of Heavy Metal Pollution in the sediments of the Lower Litani River Basin, Lebanon.Jordan Journal of Earth and Environmental Sciences JJEES. 2019; 10 (2): 104-112. ISSN 1995-6681.
- N Nehme, CM Haidar, M Rammal, F Abou Abbas, H Rammal, N Al Ajouz2021, Study of the water assessment in the Alhoujair valley in Lebanon. J. Mater. Environ. Sci. 2021; 12 (11): 1392-1404.
- Gautam SP. Water and Wastewater Analysis. Control Pollution Control Board.
- Guidelines for Drinking-Water Quality: Fourth Edition Incorporating the First Addendum. Geneva: World Health Organization; 2017. PMID: 28759192.
- WHO. World Health Report 1999. World Health Organization. Geneva. 1999.
- Ministry of Health (MoH). Strategic Plan 2013-2016 Non-Communicable Diseases and Their Risk Factors. Version 1, Ministry of Health, Lusaka. 2013.
- Mulugeta S. Assessment of Drinking Water Quality in Mercato, Addis Ababa. Department of Civil Engineering Addis Ababa University. 2012.
- Sanches SM, Muniz JM, Passos C, Vieira EM. Chemical and microbiological analysis of public school water in Uberaba Municipality. Ambiente and Agua Journal of applied science. 2015.
- Suk WA, Ruchirawat KM, Balakrishnan K, Berger M, Carpenter D, Damstra T, de Garbino JP, Koh D, Landrigan PJ, Makalinao I, Sly PD, Xu Y, Zheng BS. Environmental threats to children's health in Southeast Asia and the Western Pacific. Environ Health Perspect. 2003 Aug;111(10):1340-7. doi: 10.1289/ehp.6059. PMID: 12896856; PMCID: PMC1241616.
- Tay C. Report on the Ground Water Quality of Akatsi and Ketu Districts in the Volta Region of Ghana. CSIR – WRI. 2004.
- WHO Regional Office for Europe. Sodium, Chlorides, and Conductivity in Drinking Water, A Report on A WHO Working Group. Copenhagen, EURO Report and Studies 2. 1978.
- WHO, author. Drinking-water Quality Standards, Objectives and Guidelines Technical Support Document for Ontario Drinking Water Standards, Objectives and Guidelines June 2003. Ministry of Environment; 2003.
- World Bank. Republic of Lebanon - Water sector: public expenditure review. Public expenditure review (PER). Washington, DC: World Bank. 2010.
- World Health Organization (WHO). International Standards for Drinking Water, Geneva. 1958.
- World Health Organization (WHO). Guidelines for Drinking Water Quality, Genève: World Health Organization, 2nd ed. 1996.
- World Health Organization (WHO). Guideline for Drinking Water Quality, Health criteria, 2nd ed., 2. 1997.
- World Health Organization (WHO). Guidelines for Drinking Water Quality, Genève: WHO Press, 4th ed. 2011.
- World Health Organization (WHO). Water and sanitation. World Health Organization Regional Office. 2013.
- Maruthi YA, Hossain K, Goswami A. Assessment of drinking water quality in some selected primary schools in Visakhapatnam. Pelagia Research Library. 2012; 3(5):1071-1074. www.pelagiaresearchlibrary.com
- Napacho ZA, Manyele SV. Quality assessment of drinking water in Temeke District (part II): Characterization of chemical parameters. African Journal of Environmental Science and Technology. 2010; 4(11): 775-789. http://www.academicjournals.org/AJEST