
More Information
Submitted: March 18, 2024 | Approved: April 01, 2024 | Published: April 02, 2024
How to cite this article: Diab W, Farhat M, Rammal M, Haidar CM, Yaacoub A, Hamzeh A. Drinking-water Quality Assessment in Selective Schools from the Mount Lebanon. Ann Civil Environ Eng. 2024; 8: 018-024.
DOI: 10.29328/journal.acee.1001061
Copyright License: © 2024 Diab W, et al. This is an open access article distributed under the Creative Commons Attribution License, which permits unrestricted use, distribution, and reproduction in any medium, provided the original work is properly cited.
Keywords: Water quality; Schools; WHO standards; Contamination; Diseases

Drinking-water Quality Assessment in Selective Schools from the Mount Lebanon
Walaa Diab1, Mona Farhat1,2, Marwa Rammal3, Chaden Moussa Haidar2,3*, Ali Yaacoub4 and Alaa Hamzeh1,2
1Faculty of Science, Lebanese University, Rafic Hariri University Campus, Hadath, Lebanon
2Islamic University of Lebanon, Khaldeh, Lebanon
3Faculty of Agricultural Engineering and Veterinary Medicine, Lebanese University Dekwaneh, Beirut, Lebanon
4Industrial Research Institute Lebanese University, Rafic Hariri University Campus, Hadath, Lebanon
*Address for Correspondence: Chaden Moussa Haidar, Islamic University of Lebanon, Khaldeh, Faculty of Agricultural Engineering and Veterinary Medicine, Lebanese University Dekwaneh, Beirut, Lebanon, Email: [email protected]
The present study aims to assess and compare the quality of drinking water according to WHO Standards and then illustrate the resulting diseases. Eight samples have been taken from selective different schools in the Mount Lebanon Region. The laboratory tests of the collected samples were performed to determine various physical (e.g., temperature, pH, electrical conductivity, etc.), chemical (Ca+2, Cl-, Fe, Mg2+, NO3, Na+, SO2-4), and microbial such as E. coli, coliform, and non-coliform. Several techniques were used for the analysis including Atomic Absorption Spectrometry, Flame Photometer, and Total Organic Carbon (TOC). The resulting water quality was compared with the standard limits. Each school has different defects according to specific contamination that existed. To save local residents and according to the results of this study, regular monitoring for water quality was proposed; besides more water filtration plants should be installed to provide safe drinking for children’s health.
The availability of safe and reliable water resources is a crucial aspect of the sustainable development and well-being of any region [1]. The major purpose of monitoring drinking water quality is the protection of public health [2]; especially in schools where water quality testing is rarely applied. According to the sustainable development goal SDG6, water with pure quality is essential to sustain life, and a satisfactory (i.e., adequate, safe, and accessible) supply must be available to all. Improving access to safe drinking water can secure human health and even life [3,4]. Every effort should be made to achieve drinking water quality as safe as possible. Thus, pure drinking waters should not include any significant risk to health over a lifetime of consumption [5]. Infants and young children who are debilitated or living under unsanitary conditions and the elderly are always at water risk. This is widespread in many societies, notably in low-income regions. Safe drinking water is suitable for all usual domestic purposes, including personal hygiene [6,7].
Even though, there is always attention to the drinking water quality in small and low-income communities; specifically, notably in schools, the majority of water quality problems are often related to bacteriological contamination [8]. While physiochemical contamination is much more found in water sources that belong to agricultural practices and malpractices [9-11].
Lebanon, with 10452 km2, is located along the Eastern side of the Mediterranean Sea, where 4.3 million people live [12,13]. The country is highly urbanized and more than 85% of the population lives in urban areas, and more than 70% of them live in the coastal zone. For example, the Capital Beirut occupies about half of the country’s population. Even though, water resources are relatively abundant in Lebanon, yet water supply and sanitation sector has not achieved acceptable levels of services, and it is still far from the level of economic development reached by the country [14].
Mount-Lebanon Region, where the study was carried out, extends into the Middle part of Lebanon and faces the Mediterranean Sea. The study area of Mount Lebanon receives a considerable amount of precipitation, including rainfall and snow, while the average annual precipitation rate is about 910 mm [15,16]. Recently, rapid population increase, as well as the economic and educational developments of the city brought big stress on natural resources including surface water and groundwater, as well as the related nexus [17] (e.g. agriculture, energy, and food). In particular, the quality of groundwater is always found with contaminated in many areas of Mount Lebanon, and it highly threatens the health of the local inhabitants. Thus, the number of dug wells in the capital Beirut exceeds 5000 wells per square kilometer [18]. This resulted in a lower water table, and thus the intrusion of saltwater into the coastal aquifers as an aspect of water quality deterioration in Lebanon which influences the schools, while these schools are concerned with providing safe drinking water to students and staff. Drinking water provided by schools is regulated under the Federal Safe Drinking Water Act (1974) and state laws and regulations [19,20]. If a school receives drinking water from another provider, then it can be assured that its water should be regularly tested to ensure that it meets federal and state drinking water standards. In order to have schools' water pure and safe, there must be protection works for the sources where water is received from. Hence, regularly testing and reporting monitoring results, and maintaining the distribution system is necessary to be done.
There is no (or sometimes very few) data and records on sources of the drinking water, notably for the microbial and even physiochemical characteristics. Therefore, water-resulted diseases often infect students, and the issue is treated as if it is a natural infection.
Recently, the high bacteria content detected in water samples collected from the Lebanese schools prompted the Ministry OF Health (MoH) in coordination with the Ministry of Education, to launch awareness campaigns to address water sanitation in the Lebanese schools.
MoH in Lebanon declared that about 49% of samples that underwent bacterial tests failed to meet the necessary standards. Therefore, the ministry collected 210 water samples from 190 private and public schools across the entire Lebanon to carry on the microbiological tests [21].
The main objective of this study is to assess the quality of water from selective schools located in Mount Lebanon, and certainly from schools located between Baabda and Ain el Roumaneh region. The investigated water samples receive their water from “Ain El Delbi, a major issuing spring in Mount Lebanon. In particular, the present study aims at:
-Determining the physicochemical and microbiological quality of water and comparing the various parameters with WHO guideline values.
-Identifying the possible sources of contamination.
-Evaluating the spatial similarities or differences between sampling sites to identify the source of pollution and eliminate it.
Samples collection
In order to assess groundwater quality and its related diseases, water samples were collected from schools during the summer period (June 2016). This was achieved from the eight schools (Table 1) in Mount Lebanon (Baabda, Mreieh, Chiah, and Ain Roumaneh). The water in these regions receives water under the mandate of Mount-Lebanon Water Establishment (MLWE).
| Table 1: Sites of water samples. | |||
| Sample | Location Name | Source of water | Type of school |
| S1 | Baabda | Ein el Delbi (Spring) | Private |
| S2 | Baabda | Ein el Delbi (Spring) | Private |
| S3 | Baabda | Well | Private |
| S4 | Chiah | Ein el Delbi (Spring) | Public |
| S5 | Ein El Roumaneih | Ein el Delbi +Well | Private |
| S5 | Ein El Roumaneih | Well | Private |
| S7 | Mreijeh | Ein el Delbi+ Well | Public |
| S8 | Chiah | Ein el Delbi (Spring) | Public |
| The school's names are confidential. | |||
For the purpose of sampling, clean polyethylene bottles were used to conserve water samples, and they were presoaked overnight in 10% (v/v) nitric acid; and then rinsed three times with distilled water and then by the water being sampled.
Samples for analysis were picked from dug water boreholes, as the main source of drinking water, tanks, and faucets according to the headmaster of the school using two (2L) polyethylene bottles. Each school was assigned two types of samples, a bottle (2L) without adding acid, and the second bottle was supplied by 2% nitric acid to acidified (pH < 2) and stored in portable coolers before transporting to the laboratory testing.
Physical parameters were done in situ (related to applied field survey) including pH, temperature, Total Dissolved Solid (TDS), and electrical conductivity (Ec). In the field survey, the instruments (Hanna Instruments: pH Meter Model HI 98103 and Hach Model 44600 Conductivity/TDS Meter) were immersed in water for fifteen minutes. The method of sampling and collection followed the Standards Methods by WHO (2017) and Libnor (1992).
Therefore, all samples were labeled with a specific symbol or name.
Preservation of samples
To avoid any potential volatilization or biodegradation between sampling and analysis, samples were kept as cool as possible, but without freezing. All samples were collected, preserved, and stored for analysis as outlined in Standard Methods for the Examination of Water and Wastewater (2005). Thus, samples were analyzed directly on arrival at the laboratory, whereas in case of no capability for immediate analysis, samples were stored at 4 °C.
Watercolor
Pure water usually seems to be a colorless liquid; however, it possesses some level of color. Unfavorable colors of groundwater samples can originate from the decomposition of colored organic matter, humic substances, metals such as iron or manganese, or leakage from sewage. The main reason for the change in water color was the seeping of pollutants in rock reservoirs, over-exploitation of water, and low water table with passing time.
Watercolor was simply and cheaply measured using a handheld Spectrophotometer photopette or simple colorimeter or using visual comparison with known standards. However, water collected from all schools had with clear appearance (i.e. colorless).
Physical measures
The resulting physical parameter concentrations in the samples of the study area are presented in Table 2.
| Table 2: Results of Physical Parameters of Samples. | ||||
| Samples | pH | TDS (ppm) | EC (µs) | Salinity (ppm) |
| S1 | 7.57 | 610 | 884 | 450 |
| S2 | 7.18 | 630 | 900 | 450 |
| S3 | 7.78 | 580 | 848 | 400 |
| S4 | 7.9 | 370 | 549 | 270 |
| S5 | 7.99 | 270 | 418 | 490 |
| S6 | 8 | 310 | 443 | 220 |
| S7 | 7.45 | 6060 | 2857 | 4280 |
| S8 | 7.72 | 370 | 534 | 260 |
| Standard limits WHO 2013 |
6.5 - 8.5 | 1000 | 1000 | 1 ppt |
pH: pH is a significant factor where it is evidence of water pollution. pH measures of the water samples were obtained between 7.18 and 8 in all schools as shown in Figure 1. The results showed that water samples tend to be neutralized or a little alkaline according to WHO standards.
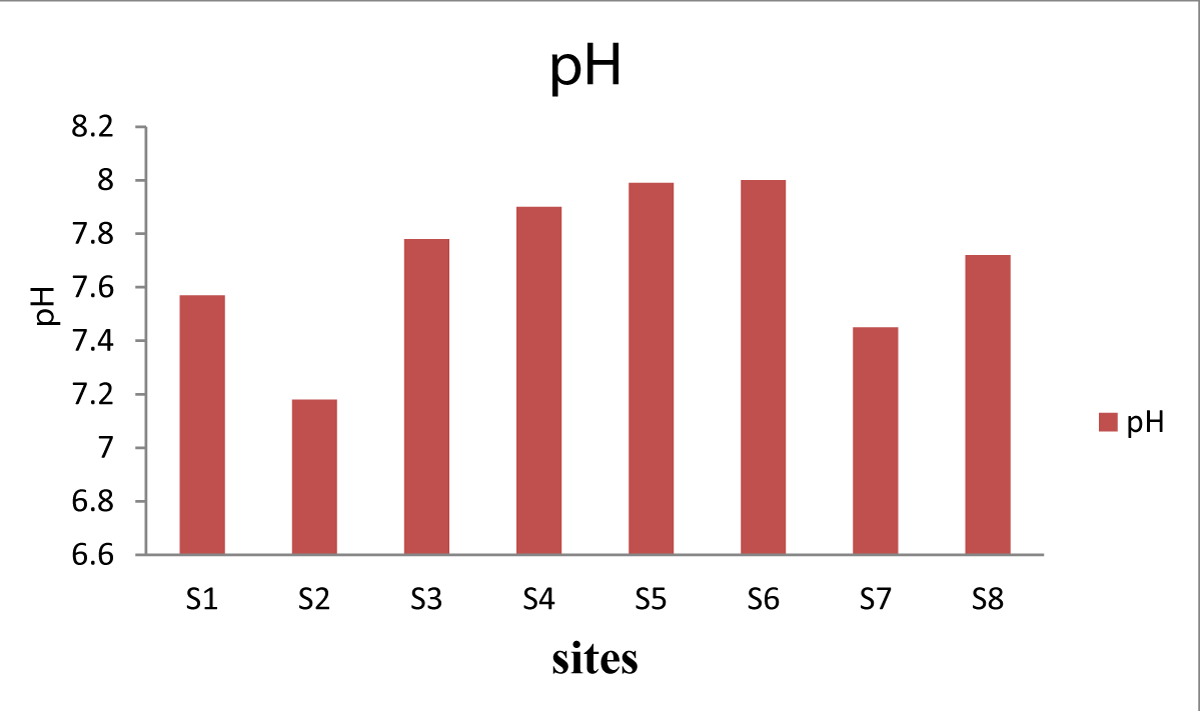
Figure 1: pH values from the selected sites.
Total Dissolved Solids (TDS): The water of samples is gaining various compositions from feeding sources and access to the discharge area due to exposure to multiple processes causing changes in the chemical composition, such as evaporation, increasing the concentration of elements conveyed through the percolating water, and other mixing processes.
TDS results were acceptable in all investigated schools (i.e. less than 1000 ppm) except in school S7. The concentration of TDS ranged from (370) ppm to (8000) ppm as shown in Figure 2. The increased TDS concentration may be attributed to the rock lithologies where groundwater is stored, but in this case, it is due to the direct rejection of wastewater or due to the precipitation of organic matter in the canal.
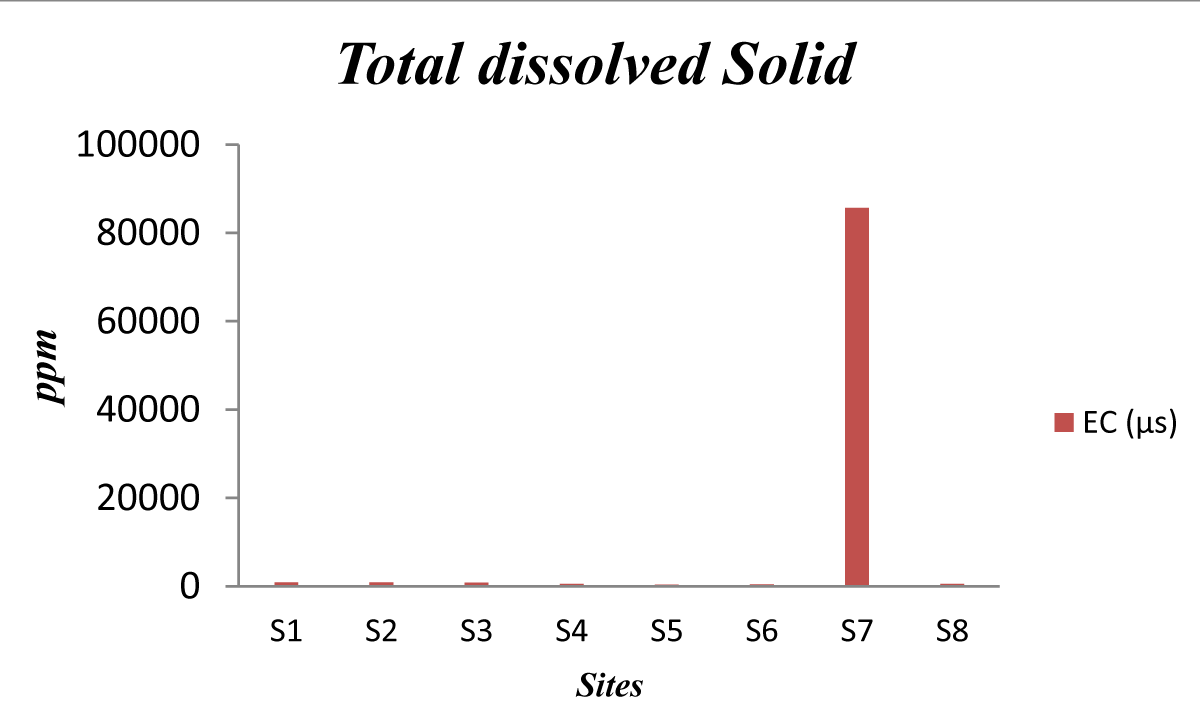
Figure 2: Total Dissolved Solid.
In School # S7, this value was found very high, and it is not acceptable for potable water. According to WHO standards for drinking purposes, water containing more than 1000 mg/L of TDS is not considered desirable for drinking water supply.
Electric conductivity (EC): EC directly belongs to the total dissolved solid, because the ions coming up from the breakdown of the compound (dissolved solids) are responsible for conducting electric current. WHO recommends a maximum of 1000 µS per cm as favorable for drinking water. Therefore, all schools have acceptable EC values except school # S7 (Figures 3,4) where the value reached 8.57 µS. This value reveals a high quantity of ions due to dissolved solids.
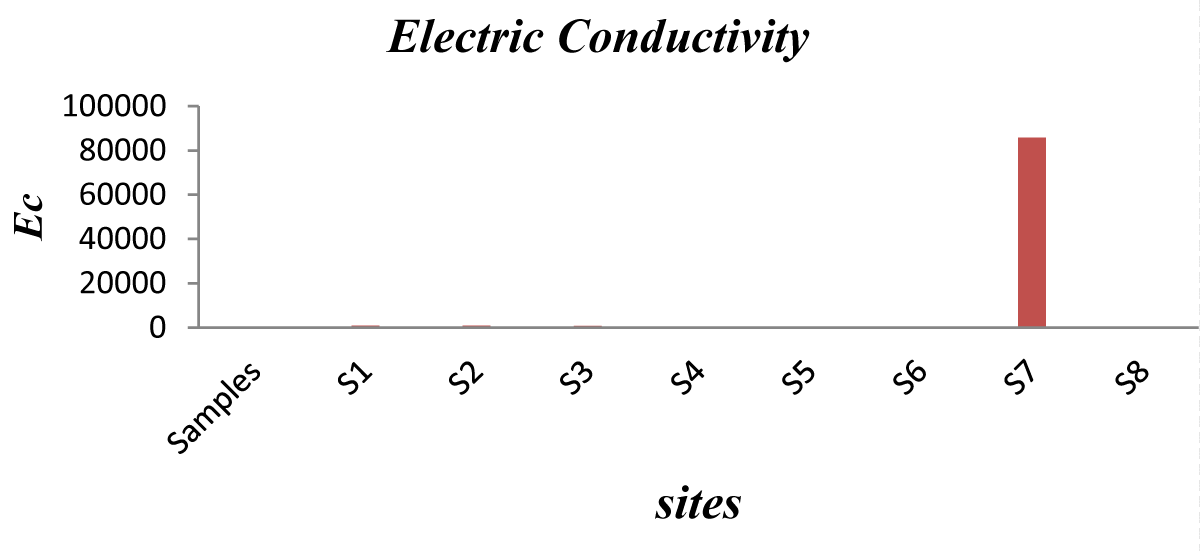
Figure 3: Electric Conductivity Values..
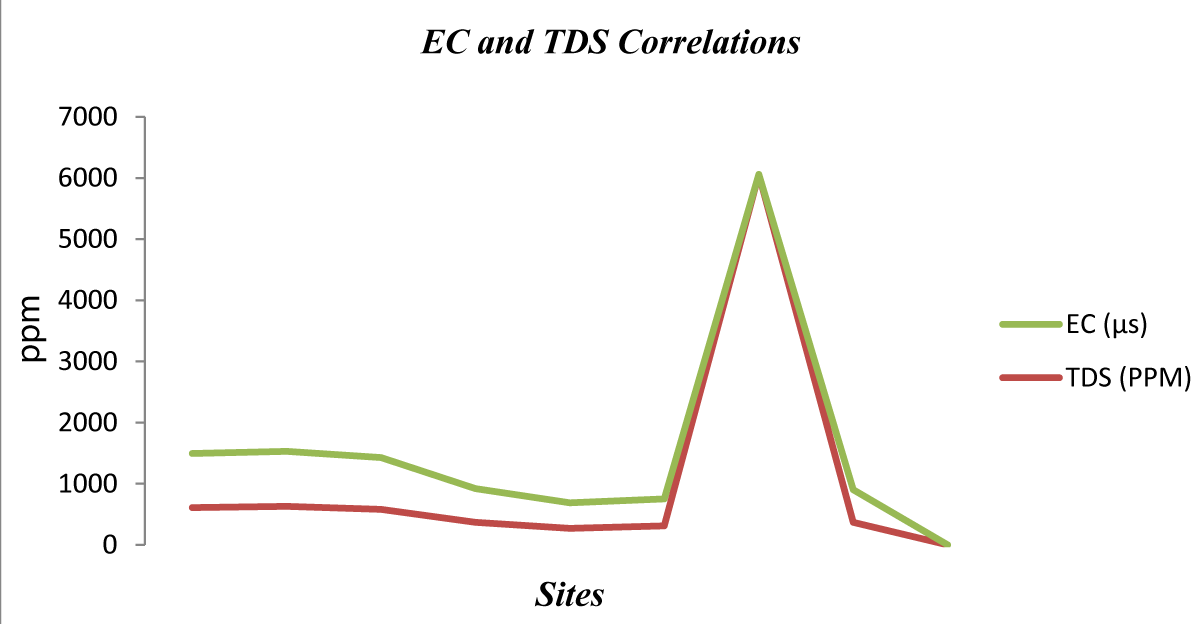
Figure 4: Correlation between TDS and EC.
Salinity: Salinity, as another parameter for the amount of salt in water, is the result of the dissolved solids, which are usually found in drinking water 1 ppt.
The results revealed from the samples are all non-saline (Figure 5), but is remarkably higher value was detected also in school # S7. This assures the remarkable saltiness in this potable water.
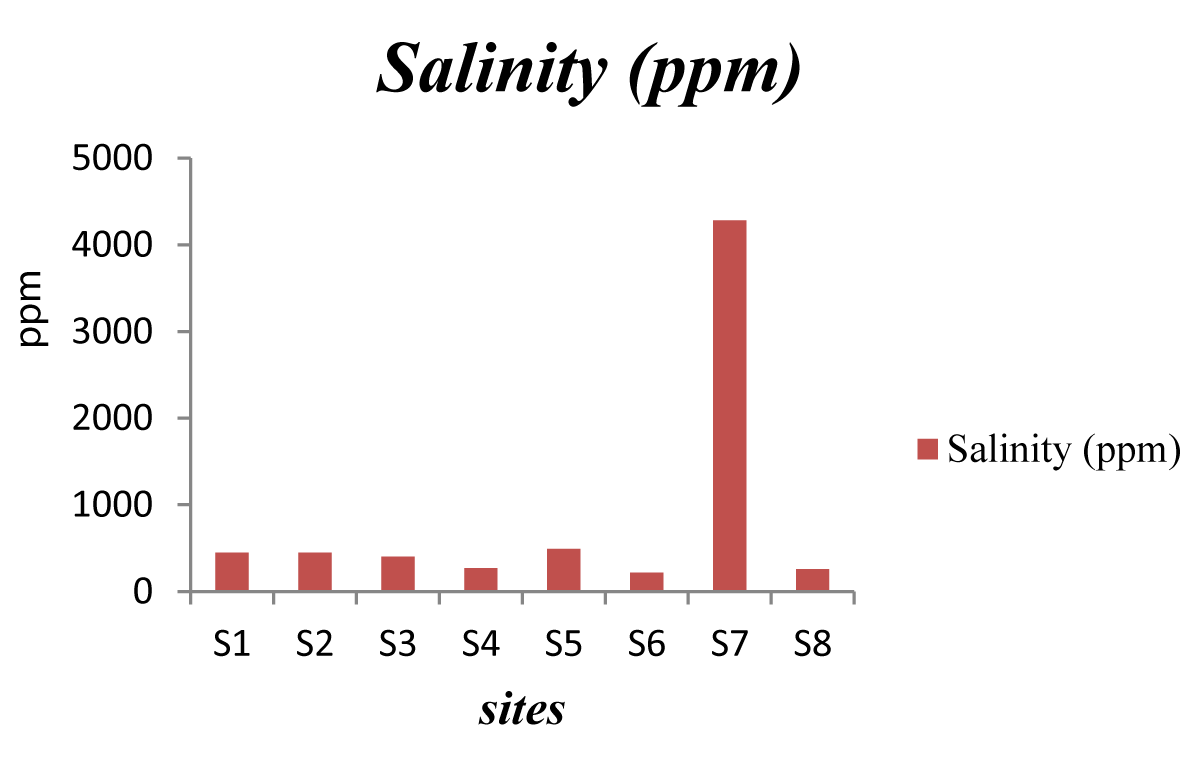
Figure 5: Resulted salinity analysis.
Results of chemical measures
The Cation (metals) in water: Table 3 shows the results of metals present in the water samples. Each sample was diluted until it reached a legible result.
Calcium ion Ca2+: The Ca2+ levels of the various sampling were between 96.4 and 128.5 mg/l (Table 3). Therefore, all tested samples were within the WHO-acceptable standards (i.e. 200mg/l). The lowest level was found in S1 (96.4 mg/l) and the highest level was found in S8 (128.5 mg/l) as shown in Figure 6. The level of Ca2+ concentration in the various samples may be attributed to the natural origin (i.e., rock lithology) of calcium compounds in sediments and the related soil. Thus, no evidence of adverse health effects that could be attributed to calcium and magnesium contents in drinking water has been found. However, undesirable effects due to the presence of calcium and magnesium in drinking water are often due to their sources or sometimes from the ability to render water hard [22,23].
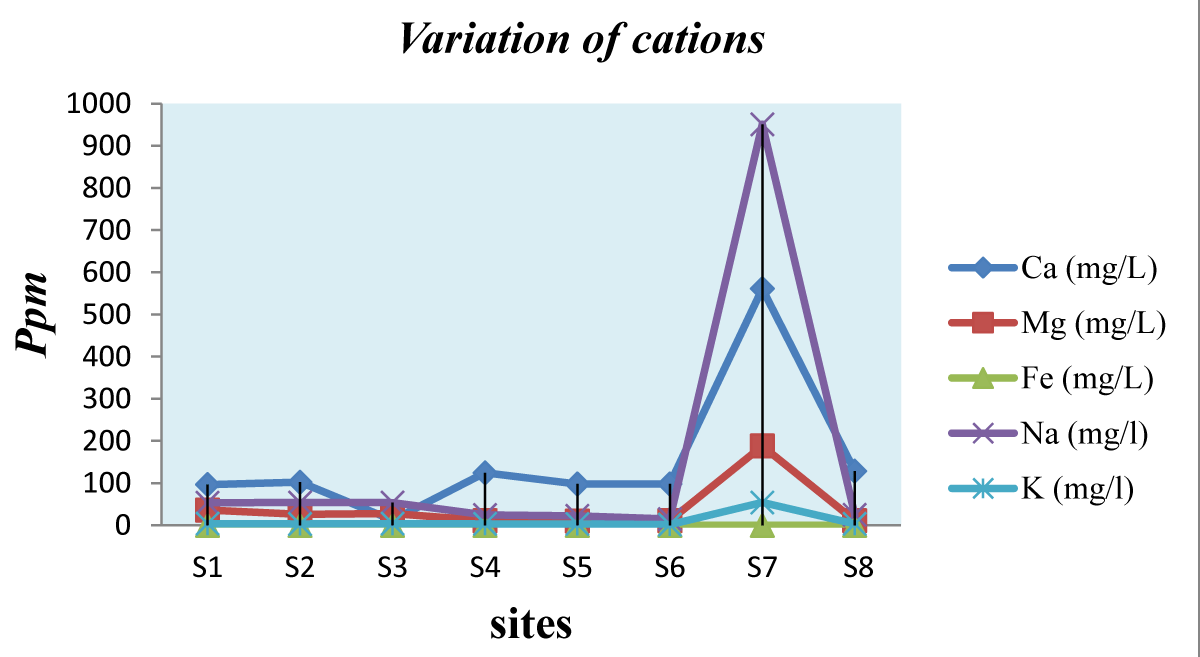
Figure 6: Variation of Cations in the school’s water samples.
| Table 3: Results of Metal Analysis. | |||||
| Samples | Ca (mg/L) | Mg (mg/L) | Fe (mg/L) | Na (mg/L) | K (mg/L) |
| S1 | 4.82 | 0.36 | 0 | 53.3 | 3.9 |
| S2 | 3.41 | 0.26 | 0 | 54.2 | 3.2 |
| S3 | 3.93 | 0.28 | 0 | 53.9 | 3.9 |
| S4 | 4.15 | 0.11 | 0 | 24.5 | 3.4 |
| S5 | 3.26 | 0.1 | 0 | 22.5 | 3.3 |
| S6 | 3.27 | 0.11 | 0 | 14.8 | 1.6 |
| S7 | 5.61 | 0.47 | 0 | 951 | 54.1 |
| S8 | 2.57 | 0.11 | 0 | 25 | 3.4 |
| Standard limits WHO (20130 |
75 | 150 | < 0.3 | 2 | 12 |
Magnesium: Magnesium ion concentrations for the eight water samples were found within the WHO acceptable guidelines (i.e., 150 mg/l) which are in ascending order: S5 (10 mg/l); S4, S6 and S8 (11 mg/l); S2 (26 mg/l); S3 (28 mg/l); S1 (36 mg/l) (Table 3). The remaining sample # S7 exceeded the WHO limits (Figure 6); its magnesium concentration reached 188 mg/l.
Similarly, to Calcium, there is no evidence of adverse health effects due to Magnesium content found in the tested samples, while, the undesirable effects of Mg in drinking water may be attributed to its ability to render water hard.
Iron: Iron is not harmful at its acceptable concentration, but gives an unfavorable taste to water when present in considerable amounts. In the opposite of many organic and microbiological contaminants, many metals tend to deposit in the upper layer of soil, which aggravates their effects on the local ecosystem (WHO, 2006). Sampled water from all schools was characterized by an ordinary concentration of iron (Table 3 and Figure 6) and was below WHO maximum acceptable limits of 0.3 mg/l.
Sodium: Water samples # S1, S2, S3, S4, S5, S6, and S8 had appreciably low Na+ levels, ranging from 22.5 to 54.2 mg/l; respectively, and it is occupied within WHO maximum acceptable limits for drinking water (i.e., 200mg/l). Yet, school # S7 recorded an extremely high value of sodium concentration (951 mg/l, Figure 6) and this exceeds the WHO limits Table 3. The higher level observed in # S7 can be a result of natural mineral deposits and rock lithology in water. While Na+ has a positive correlation with Cl-. This shows that factors that may have contributed to Cl- may directly affect Na+ content.
Potassium: Samples # S1, S2, S3, S4, S5, S6, and S8 showed acceptable K+ concentration compared to WHO guideline level of 30 mg/l (Figure 6, Table 3). The level ranged from 1.6 to 3.9 mg/l. Figure 6 shows that the lowest level was found in S6 (1.6 mg/l) and the highest level was in # S1 and # S3 (3.9 mg/l). Only one school (i.e., S7) revealed an exceeded value with respect to WHO limits where the potassium concentration in their drinking water reached 54.1 mg/l.
The anions in water: Table 4 shows the concentration of chloride, nitrates, and sulfate ions in the tested water samples.
Chloride analysis: According to WHO, the concentration of chloride should not exceed 250 mg/l for drinking water. The results shown in Table 4 and Figure 7 reveal that sample # S7 exceeds the permissible limits (i.e. 2282.65 mg/l). This may be attributed mainly to seawater intrusion which is predominant in the coastal region.
| Table 4: Results of Anion analysis in water samples. | ||||
| Sample | Chloride (mg/l) | Nitrate ( mg/l) | Sulfate (mg/l) | Bicarbonate (mg/l) |
| S1 | 31.95 | 4.94 | 71.5 | 22 |
| S2 | 21.3 | 3.84 | 74.6 | 23 |
| S3 | 28.4 | 3.79 | 55 | 24 |
| S4 | 3.55 | 1.76 | 59.5 | 28 |
| S5 | 14.2 | 0.38 | 37.5 | 25 |
| S6 | 7.1 | 1.5 | 12.6 | 21 |
| S7 | 2282.65 | 0.46 | 318.62 | 309 |
| S8 | 0 | 2.08 | 37.6 | 38 |
| Standard limits WHO, 2013 |
250 | 50 | 250 | 500 |
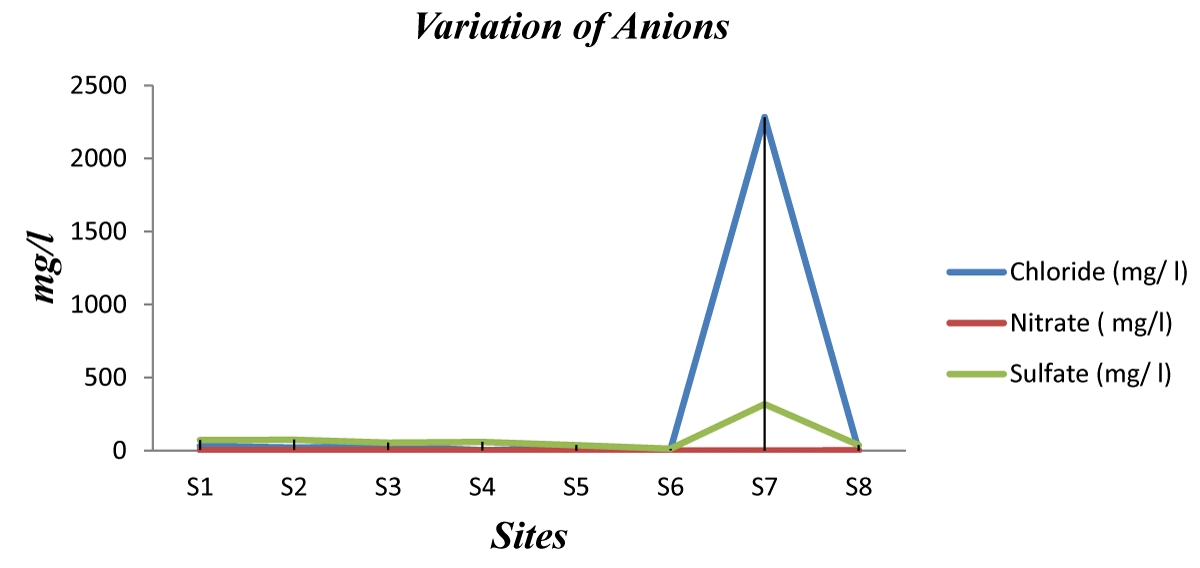
Figure 7: Variation of Anions in water samples.
Nitrate analysis: Using a Spectrophotometer (the colorimetric method), the absorption measures of each sample were achieved. This was utilized to draw the curve with respect to the concentration of nitrate. Nitrate concentration being toxic for consumption through potable water is determined by WHO (2013) about 50 mg/l. thus, all investigated samples have acceptable concentrations of nitrate (Table 4 and Figure 7). The concentrations ranged between 0.38 and 3.84 mg/l, and this is acceptable because in all the sites no agricultural activities were observed.
Sulfate analysis: SO42- concentrations in water may be affected by the natural occurrence of sulfate compounds in sediments and the related soil. SO42- may also be leached in the groundwater as a result of farming activities which are located in the surrounding of the studied regions. While atmospheric sulfur dioxide (SO2) is formed by the combustion of fossil fuels and by the metallurgical roasting mechanism, it may also contribute to the sulfate content of surface waters as shown by Keller, et al. (1986). It is often noticed that the levels of sulfate in surface water correlate with sulfur dioxide in emissions from anthropogenic sources (Keller and Pitblade, 1986). Whereas, a high concentration of SO42- may decrease the pH of water and can increase its bacterial load, such as the sulfate-reducing bacteria (Delisle, et al. 1977).
Drinking water sampled from the surveyed schools were generally with low SO42- concentrations that ranged between 12.6 and 74.6 mg/l (Table 4). All tested samples were found within WHO-acceptable maximum contaminant limits (250 mg/l), except sample # S7 which showed a very high value.
TOC analysis: TOC calculates the total concentration of all organic carbon atoms covalently bonded in the organic molecules in a water sample. Thus, there were remarkable Total Carbon (TC), Inorganic Carbon (IC), Total Organic Carbon (TOC), and Carbone derived from decaying vegetation, bacterial growth, and metabolic activities of organisms or chemicals (TOC = TC - IC). Table 5 shows the results of the TOC analysis.
| Table 5: Results of total organic carbon. | |||
| Sample | TC (mg/l) | IC (mg/l) | TOC (mg/l) |
| S1 | 95.91 | 73.38 | 22.53 |
| S2 | 104.66 | 73.13 | 31.53 |
| S3 | 90.16 | 64.28 | 25.88 |
| S4 | 53.43 | 40.55 | 12.88 |
| S5 | 31.89 | 24.53 | 7.36 |
| S6 | 47.29 | 36.74 | 10.55 |
| S7 | 59.73 | 44.97 | 14.76 |
| S8 | 38.85 | 37.3 | 1.15 |
| Standards WHO 2013 |
- | - | 24.97 |
The resulting TOC values were between 1.15 and 22.53 mg/L for samples # S8 and # S1; respectively. These values are within the limit compared to the norm which is 24.97 mg/L. While, the remaining two samples exceeded the norm, # S2 (31.53 mg/l) and S3 (25.88 mg/l). TOC is a highly sensitive, non-specific measurement of all organics present in collected samples. This can be elaborated to regulate the organic chemical discharge to the environment. In addition, the low TOC indicates the absence of potentially harmful organic chemicals in water used in the manufacturing of pharmaceutical products. Therefore, the existing TOC revealed that potable water in these schools is harmful and not suitable for drinking purposes.
Bicarbonates: All the sources of water have levels of bicarbonates within the WHO acceptable limit of 500 mg/l..
Results of micro-biological testing
According to the achieved microbial analysis, the results show in Table 6 that a considerable number of colonies grow in all tested samples upon PCA. This indicates the presence of many bacteria in the potable water in the surveyed schools. The test was done at 37 °C and revealed a change-like shape in color. This change in color reveals the presence of coliforms at different percentages:
| Table 6: Results of microbial analysis. | ||||
| Samples | PCA | Mc 37° | Mc 45° | SS |
| S1 | + | + (10%) | - | - |
| S2 | + | + (50%) | + | + |
| S3 | + | + (70%) | - | - |
| S4 | + | - | - | - |
| S5 | + | + (100%) | + | - |
| S6 | + | - | - | + |
| S7 | + | + (100%) | + | + |
| S8 | + | - | - | + |
| Note WHO 2013 |
Non-determined number of colonies | The color changed to yellow | Slightly change in medium color. Colonies are not countable | Colonies are not black → presence of entero-bacteria |
| +: Positive test, bacteria are found in the samples. -: Negative test, no bacteria grew. |
||||
-# S1 changed color to yellow about 10%.
-# S2 changed to yellow 50%.
-# S3 changed to yellow at 70%.
-# S5 and S7 changed completely to yellow %.
At 45 °C, the Mc test will reveal the E. coli species since other coliforms are unable to tolerate high temperatures. The results showed that samples # S2, S5, and # S7 include (slightly change in medium color. Colonies are not countable) coliforms of E. coli species.
In the Salmonella Shigella test, which is the bacterium that contributed to poisoning, a slight change in colonies was identified, but it did not show black color or spots, which indicates that salmonella is not present. This change in color could be a result of the presence of Entero bacteria. Samples that include Entero bacteria according to the results are # S2, S6, S7, and # S8.
The total coliform bacteria and E.coli in the water sample should be zero. However, the microbial indicator levels that were observed in the water of these schools revealed that water is not suitable for drinking and does not meet the WHO limits [24-31].
Parents are unaware of the potential deterioration in the quality of drinking water at schools. This suggests a lack of knowledge and awareness regarding water quality issues. Additionally, due to low-income levels, lack of governmental control, and a lack of awareness, many individuals do not utilize water treatment methods. While some schools employ water treatment mechanisms such as boiling or water purification tablets, the majority do not, leading to insufficient treatment based on water quality parameters.
Furthermore, poor sanitation and hygiene practices in schools significantly contribute to water contamination during transportation and storage. In addition, leakage in drinking water pipes exacerbates this issue, potentially contaminating water with solid and liquid wastes due to inadequate waste management by these communities.
All water samples analyzed in this study contained high levels of microbial indicators, surpassing the recommended guidelines for drinking water set by the WHO (2006) This underscores the unsuitability of water from these sources for consumption without prior treatment.
Few number of schools utilize water filters for treatment. However, chemical analysis of ions indicated that while samples met WHO standards for Calcium, Iron, and Nitrate, issues were observed with Sodium, Potassium, Magnesium, Sulfate, and Chloride levels in some samples. Microbial analysis revealed a significant microbial presence in all water samples, indicating unsuitability for drinking or domestic use
To address these challenges, an integrated approach to reducing fecal contamination in school water sources within the community is necessary. This involves developing comprehensive water resource management programs to support poverty reduction, economic growth, food security, and environmental preservation. Additionally, public engagement in water management is essential to empower the knowledge of people on water-wise use.
Recommendations include promoting the use of water treatment methods such as water purification tablets; especially in low-income communities where access may be limited and regular inspection and maintenance of water supply systems to prevent contamination are crucial, along with effective solid and liquid waste management, potentially involving private sector participation. There is also training and awareness initiatives should be implemented, ensuring that individuals are equipped with the necessary skills to address water quality issues. This includes educating staff, particularly teachers in schools, on water conservation and sanitation practices. Finally, public awareness campaigns should be also conducted to emphasize the importance of clean water consumption and proper water handling practices. This can be achieved in collaboration among stakeholders is essential for implementing and improving understanding of water contaminants and treatment methods within the community [32,33].
The study provides insight into the physicochemical properties of water collected from various sites in Mount Lebanon. Analysis revealed normal pH levels ranging from 7.05 to 8 across all samples. Total Dissolved Solids (TDS) were generally acceptable except for one sample (S7) with a high TDS value of 6060 ppm. Electrical Conductivity (EC), which correlates with TDS, also exhibited elevated levels in the same sample (8.57 ppm), along with salinity (4250 ppm).
For the microbiological tests, there is slight bacterial contamination, where the total coliform bacteria, while the Entero bacteria existed in some samples, besides no evidence of salmonella. However, this reveals that the microbiology of water is also under threat in the surveyed schools.
- Rahman A, Islam M, Ahmed F. Physico-chemical and bacteriological analysis of drinking tube-well water from some primary schools, Magura, Bangladesh to evaluate suitability for students. International Journal of Applied Sciences and Engineering Research. 2015; 4: 5.
- Murray CJ, Lopez AD. Alternative projections of mortality and disability by cause 1990-2020: Global Burden of Disease Study. Lancet. 1997 May 24;349(9064):1498-504. doi: 10.1016/S0140-6736(96)07492-2. PMID: 9167458.
- Rout C, Sharma A. Assessment of drinking water quality: A case study of Ambala cantonment area, Haryana, India. International Journal of Environmental Sciences. 2011; 2: 2.
- LaSota DE, Bidlack TW, Evans JW. Laboratory Manual for the Microbiological Analyses of Public Drinking Water. OhioEEPA. 2001.
- Mohammed FAl, Mutasher A. Application of Water Quality Index for Evaluation of Groundwater Quality for Drinking Purpose in Dibdiba Aquifer, Kerbala City, Iraq. Journal of Babylon University/Engineering Sciences. International Conference on Water and the Environment: Development Issues for the 2lst century. 1992, Dublin, Ireland. 2013. 5:21.
- Yves L. editor. WHO, author. Minimizing potential for changes in microbial quality of treated water. London, UK: IWA Publishing. 2004.
- Kwame MM. Assessment of Drining water Quality in EHI Community in the Ketu- North District of the Volta Region of Ghana. Department of Theoretical and Applied Biology, Kwame Nkrumah University of Science and Technology, Kumasi, Ghana in Partial Fulfillment of the Requirements for The Degree of Master of Environmental Science. 2011.
- Meybeck M, Helmer R. Introduction in: Water Quality Assessments. A Guide to the Use of Biota, Sediments and Water in Environmental Monitoring. 2nd edition. Chapman & Hall, London. 1996.
- Mohsin M, Safdar S, Asghar F, Jamal F. Assessment of Drinking Water Quality and its Impact on Residents Health in Bahawalpur City. International Journal of Humanities and Social Science. 2013; 3: 15.
- Haydar CM, Tarawneh K, Nehme N, Amaireh M, Yaacoub A, Diab W. Heavy metals content in water and sediments in the upper Litani River Basin, Lebanon Journal of Geoscience and Environment Protection. 2022; 10: 7; 139-158.
- C Haydar, N Nehme, S Awad, B Koubayssi, M Fakih, A Yaacoub, Physiochemical and microbial assessment of water quality in the Upper Litani River Basin, Lebanon, J Environ Earth Sci. 2014; 4 (9): 87-97.
- Nehme N, Haydar C, Koubaissy B, Fakih M, Awad S, Toufaily J, Villieras F, Hamieh T. Metal concentrations in river water and bed sediments of the Lower Litani River.2014.
- Nehme N, Haidar CM, Dib A, Azouj N, Tarawneh K. Quality Assessment of Groundwater in the lower Litani Bassin (LLRB), Lebanon. Geosciences Research. 2020; 5: 1.
- Nehme N, Haidar CM, Diab W, Tarawneh K, Villieras F. 2019Assessment of Heavy Metal Pollution in the sediments of the Lower Litani River Basin, Lebanon.Jordan Journal of Earth and Environmental Sciences JJEES. 2019; 10 (2): 104-112. ISSN 1995-6681.
- N Nehme, CM Haidar, M Rammal, F Abou Abbas, H Rammal, N Al Ajouz2021, Study of the water assessment in the Alhoujair valley in Lebanon. J. Mater. Environ. Sci. 2021; 12 (11): 1392-1404.
- Gautam SP. Water and Wastewater Analysis. Control Pollution Control Board.
- Guidelines for Drinking-Water Quality: Fourth Edition Incorporating the First Addendum. Geneva: World Health Organization; 2017. PMID: 28759192.
- WHO. World Health Report 1999. World Health Organization. Geneva. 1999.
- Ministry of Health (MoH). Strategic Plan 2013-2016 Non-Communicable Diseases and Their Risk Factors. Version 1, Ministry of Health, Lusaka. 2013.
- Mulugeta S. Assessment of Drinking Water Quality in Mercato, Addis Ababa. Department of Civil Engineering Addis Ababa University. 2012.
- Sanches SM, Muniz JM, Passos C, Vieira EM. Chemical and microbiological analysis of public school water in Uberaba Municipality. Ambiente and Agua Journal of applied science. 2015.
- Suk WA, Ruchirawat KM, Balakrishnan K, Berger M, Carpenter D, Damstra T, de Garbino JP, Koh D, Landrigan PJ, Makalinao I, Sly PD, Xu Y, Zheng BS. Environmental threats to children's health in Southeast Asia and the Western Pacific. Environ Health Perspect. 2003 Aug;111(10):1340-7. doi: 10.1289/ehp.6059. PMID: 12896856; PMCID: PMC1241616.
- Tay C. Report on the Ground Water Quality of Akatsi and Ketu Districts in the Volta Region of Ghana. CSIR – WRI. 2004.
- WHO Regional Office for Europe. Sodium, Chlorides, and Conductivity in Drinking Water, A Report on A WHO Working Group. Copenhagen, EURO Report and Studies 2. 1978.
- WHO, author. Drinking-water Quality Standards, Objectives and Guidelines Technical Support Document for Ontario Drinking Water Standards, Objectives and Guidelines June 2003. Ministry of Environment; 2003.
- World Bank. Republic of Lebanon - Water sector: public expenditure review. Public expenditure review (PER). Washington, DC: World Bank. 2010.
- World Health Organization (WHO). International Standards for Drinking Water, Geneva. 1958.
- World Health Organization (WHO). Guidelines for Drinking Water Quality, Genève: World Health Organization, 2nd ed. 1996.
- World Health Organization (WHO). Guideline for Drinking Water Quality, Health criteria, 2nd ed., 2. 1997.
- World Health Organization (WHO). Guidelines for Drinking Water Quality, Genève: WHO Press, 4th ed. 2011.
- World Health Organization (WHO). Water and sanitation. World Health Organization Regional Office. 2013.
- Maruthi YA, Hossain K, Goswami A. Assessment of drinking water quality in some selected primary schools in Visakhapatnam. Pelagia Research Library. 2012; 3(5):1071-1074. www.pelagiaresearchlibrary.com
- Napacho ZA, Manyele SV. Quality assessment of drinking water in Temeke District (part II): Characterization of chemical parameters. African Journal of Environmental Science and Technology. 2010; 4(11): 775-789. http://www.academicjournals.org/AJEST