
More Information
Submitted: December 04, 2023 | Approved: December 20, 2023 | Published: December 21, 2023
How to cite this article: Mongtoeun Y, Sousan L, Reasey HR, Pasicolan TJA, Pasicolan PN. Current Situation of Municipal Solid Waste Management in the Urban and Peri-urban of Phnom Penh, Cambodia. Ann Civil Environ Eng. 2023; 7: 067-072.
DOI: 10.29328/journal.acee.1001057
Copyright License: © 2023 Mongtoeun Y, et al. This is an open access article distributed under the Creative Commons Attribution License, which permits unrestricted use, distribution, and reproduction in any medium, provided the original work is properly cited.
Keywords: Collection; Phnom Penh; SWM; Urban; Peri-urban

Current Situation of Municipal Solid Waste Management in the Urban and Peri-urban of Phnom Penh, Cambodia
Yim Mongtoeun1*, Lim Sousan1, Hoy Sereivathanak Reasey2, Timothy John A Pasicolan3 and Paulo N Pasicolan3
1Department of Environmental Science, Royal University of Phnom Penh, Cambodia
2Department of Natural Resources Management and Development, Royal University of Phnom Penh, Cambodia
3Former Director and Concurrent Consultant of KDFI-Philippines, Philippines
*Address for Correspondence: Yim Mongtoeun, Department of Environmental Science, Royal University of Phnom Penh, Room 112A, Building A, Russian Confederation, Toul Kork, Phnom Penh, Cambodia, Email: [email protected]
Currently, the amount of solid waste is increasing in the world, especially in developing countries. Although Solid Waste Management (SWM) involves and collaborates with many stakeholders, management is still flawed. SWM in the urban and suburbs of Phnom Penh has encountered a number of obstacles and challenges. Seeing these problems, the government has decided to reform the solid waste management in Phnom Penh in 2019. After the reform, the provision of waste collection, transportation, and cleaning services in urban and peri-urban has changed significantly, while the urban and peri-urban receive collection services 95% and 80%, respectively. To be more precise one study on the current situation of SWM in urban and peri-urban Phnom Penh was conducted to understand the current situation and to identify challenges of SWM for the urban and the peri-urban in Phnom Penh. Two kinds of data were collected 1) preliminary data was collected from interviewing people in target areas by using structured questionnaires, and 2) secondary data was obtained from existing various sources. 330 respondents were selected with qualitative and quantitative analysis by using SPPS 28.0.1.1 and Microsoft Excel 2019. People use plastic bags instead of bins, triggers, and bags to store the waste.79.5% of the people are willing to pay the collection fee. It was found that the situation of SWM is better, however, the collection time is still blurred. SWM in Phnom Penh has faced four main challenges: financial, road infrastructure, landfill, and people's participation. SWM in urban and peri-urban, still have some problems such as the packaging and storage of the waste. and the problem of scavengers tearing the waste bags makes the garbage clutter.
Cambodia is a developing country in Southeast Asia, and the last decade has seen a dramatic development in agriculture, industry, and tourism. The development of all these sectors has made Cambodia face a number of challenges related to environmental pollution, such as air pollution, water pollution, and waste pollution, especially in Phnom Penh. Waste management has become a serious problem that needs to be promptly undertaken especially in large cities such as Phnom Penh, Siem Reap, Battambang, and Preah Sihanouk due to the increasingly huge amount of solid waste and liquid waste [1]. Year after year due to population growth and rapid economic growth. Phnom Penh has a total population of 2,281,951 people, covering an area of 679km2 and is divided into 14 Khans (districts) and has a total of 105 Sangkats and a population density of 3,361/km2 [2]. The population of Phnom Penh increased from 1,327,615 people in 2008 to 2,281,951 people in 2019 [3]. Annual GDP growth has been higher than 7% since 2011, with GDP per capita rising from USD 882 in 2011 to nearly $US 1,510 in 2018 reported by the Royal Government of Cambodia (RGC) [4]. Currently, municipal solid waste is collected in the amount of around 3600 tons/day reported by the Phnom Penh Solid Waste Management Authority (PPSWMA) in 2022 with a generation rate of 0.98 kg/cap/day [1]. Solid waste management in Phnom Penh is under the jurisdiction of Phnom Penh Capital Hall (PPCH). The collection, transportation, cleaning, and disposal of waste in Phnom Penh are invested by private companies, but under the supervision of professional institutions. However, the provision of waste collection, transportation, and cleaning services is still limited and does not cover all locations, especially the peri-urban.
Waste generation and waste composition
Waste generation is increasing day by day, Figure 1 shows the waste collected and dumped at the landfill from the whole city is 3600t/day in 2022 (80% of the total) (Dangkor Landfill, 2022) while the rest is uncollected and disposed at a vacant area, back yard, waterway or burning. However, during COVID-19, 2020-2021, the waste generation and collection rate was less than usual.
Waste from different sources from 2003 to 2017 was composed of organic waste which accounted for up to 57% (Average of combination of Jica, 2003, Hul, et al. 2014, Banith and Fujiwara, 2014 and Asia Foundation, 2017) and second biggest proportion is plastic and followed by paper (Table 1). So, the treatment options can be the conversion of organic components to compost fertilizer and increased recycling activities of plastic in terms of SWM. Even currently in 2023, this composition is not much variated, however, the amount of organic waste is slightly reduced.
| Table 1: Solid Waste Composition in Phnom Penh by Various Sources. | |||||
| No | Waste Component | Waste Composition (%) | |||
| 2003 | 2014 | 2014 | 2017 | ||
| JICA (1) | Hul et al.(2) | Bandith and Fujiwara(3) | Asia Foundation/ ITC(4) | ||
| 1 | Kitchen Waste | 63.30 | 51.90 | 54.52 | 57.40 |
| 2 | Plastic | 15.50 | 20.90 | 21.23 | 18.10 |
| 3 | Paper | 6.40 | 9.90 | - | 6.00 |
| 4 | Rubber and leather | 0.10 | 0.20 | - | 0.20 |
| 5 | Bottle and Glass | 1.20 | 1.60 | - | - |
| 6 | Ceramic and stone | 1.50 | 0.50 | - | - |
| 7 | Garden (green) | 6.80 | 2.30 | - | - |
| 8 | Steel | 0.60 | 1.10 | - | - |
| 9 | Textiles | 2.50 | 2.10 | 13.04 | - |
| 10 | Others | 2.10 | 9.50 | 11.21 | 18.30 |
| Total | 100.00 | 100.00 | 100.00 | 100.00 | |
| Sources (1). JICA [5]. The study on solid waste management in the Municipality of Phnom Penh in the Kingdom of Cambodia: Final report: Main report. Japan International Cooperation Agency (2). Hul, S., Kuok, F. and Soy, T. [6]. SW generation and life lifespan with credible growth forecasts waste generation, volume, and composition. Phnom Penh: The Asia Foundation (3). Bandith, S. and T. Fujiwara [7]. "Municipal Solid Waste Characterization and Recycling Potential in Phnom Penh City, Cambodia." Faculty of Environmental Science and Technology, Okayama University (Study only 3 kinds of Waste: Food/ Organic, Plastic, and Textile) (4). Asia Foundation (2017) / Institute of Technology of Cambodia. |
|||||
Waste collection and transportation
Currently, in Phnom Penh, there are three companies responsible for waste collection, transport, and disposal at Dangkor landfill which is located around 13km from the center. There are three collection companies responsible for different zones (Zone 1, Zone 2, and Zone 3). 800 Super-GAEA company is responsible for zone 1 (5 Khans-Toul Kork, Sen Sok, Russey Keo, Chroy Changva and Prek Pnov), Mizuda Group is responsible for zone 2 (5 Khans-Daun Penh, Prampi Makara, Dangkor, Kambol and Porsenchey, and CINTRI co Ltd., is responsible for zone 3 (4 Khans- Chamkarmon, Boeung Keng Kang, Chbar Ampov and Meanchey) (Table 2). According to the Phnom Penh Waste Management Authority (PPWMA), the amount of garbage collected and dumped at the Dangkor landfill increased dramatically after the three companies went into operation in July 2021. The average amount of waste collected in the whole city was about 2,700 tons/day during COVID-19 (2019-2021), but now the average amount of waste collected and dumped at the site is about 3,600 tons/day (Figure 1).
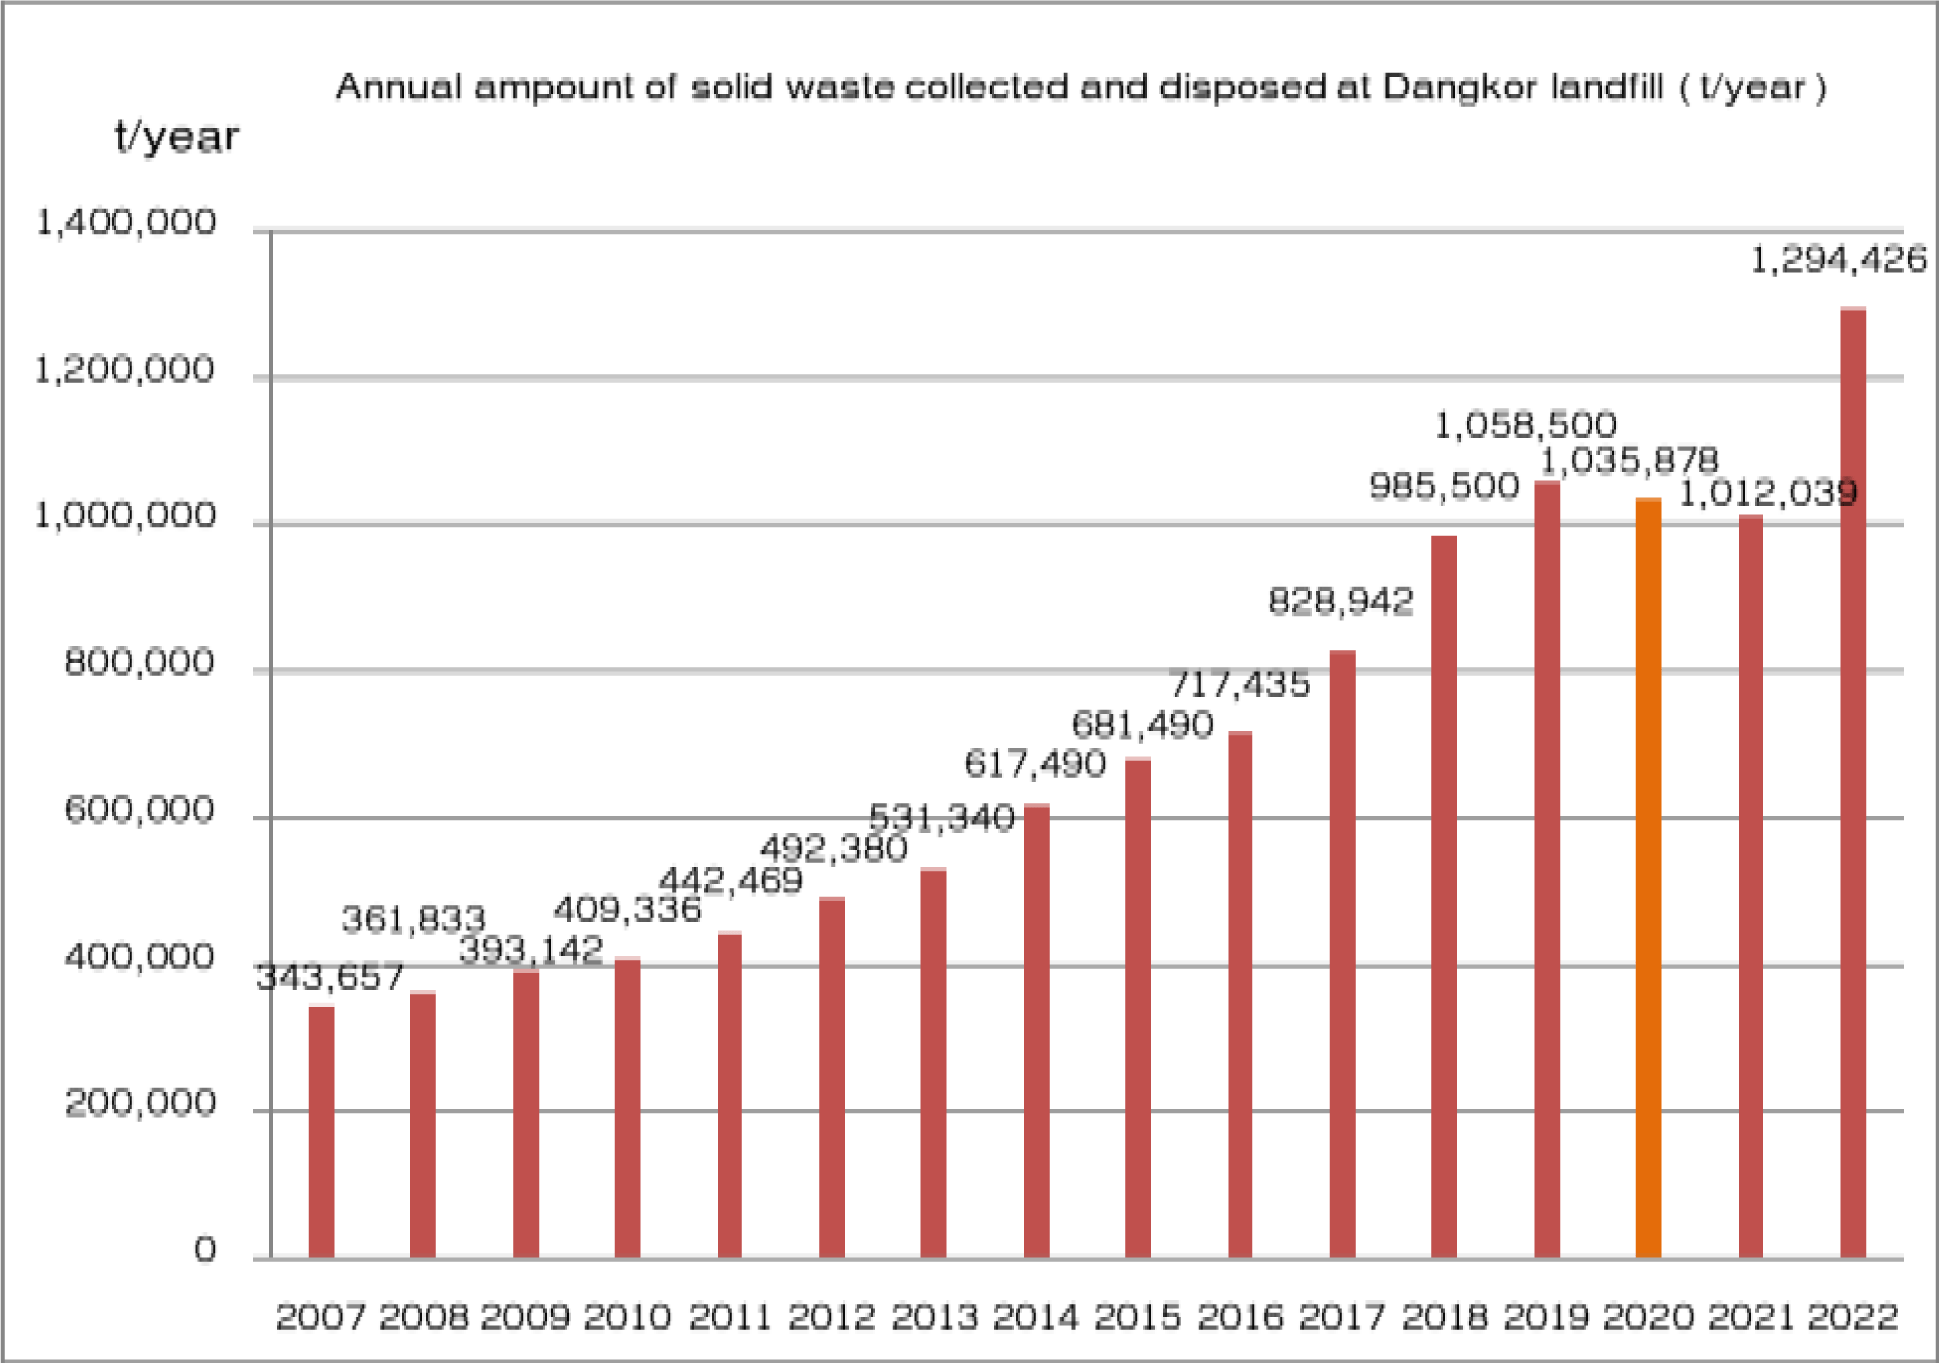
Figure 1: Amount of waste collected and disposed of at Dangkor Landfill in the last 10 years (t/year) Source: Dangkor Landfill Management Committee (2022).
Table 2 shows the companies responsible for municipal solid waste collection in each zone. So, the study area was randomly selected from these areas which were classified into urban and peri-urban. People from each zone were randomly selected both urban and peri-urban in order to it more reliable and representative for interviewing.
| Table 2: Names of waste collection companies with their zones. | ||||
| Zone | Name of Company | No of Khans | Khans belonging to each company | |
| Urban | Peri-urban | |||
| 1 | 800 Super GAEA (Cambodia) Co., Ltd | 5 | Toul Kork and Chroy Changva | Sen Sok, Reuseykeo & Prek Phnov |
| 2 | Mizuda Sanitation (Cambodia) Co., Ltd | 5 | Daun Penh & Prampi Makara | Dangkor, Kambol & Porsenchey |
| 3 | CINTRI (CINTRI)/ Everbright | 4 | Chamkamorn & Boeung Keng Kang | Meanchey & Chbar Ampov |
Objective
This study has two objectives are to:
1) Understand the current situation of solid waste management in Urban and Peri-urban areas and
2) Identify challenges in solid waste management in the Urban and Peri-urban.
In response to the above objectives, two types of data were collected 1) Preliminary data obtained from a questionnaire survey and observation, and 2) Secondary data obtained from the Internet, Ministry of Environment, Phnom Penh Waste Management Authority, Dangkor Landfill, Department of Environment, Collection Company and administration in each district. In this study, 330 respondents were randomly selected from target zones and Khans (Table 2) in response to the research topic. The data obtained from the survey was analyzed qualitatively and quantitatively using SPSS 28.0.1.1 and Microsoft Excel 2019.
Study area
Figure 2 shows the map of Phnom Penh in which the studied area of the survey for both urban and suburbs was identified. There are 14 Khans in Phnom Penh as it is rapidly urbanized while a few years ago consisted of 12 Khans. Six khans were selected, three (Boeung Kengkang, Daun Penh, Toul Kork) from urban and three (Meanchey, Kambol, Prek Pnov) from peri-urban with highlighted (Figure 2).
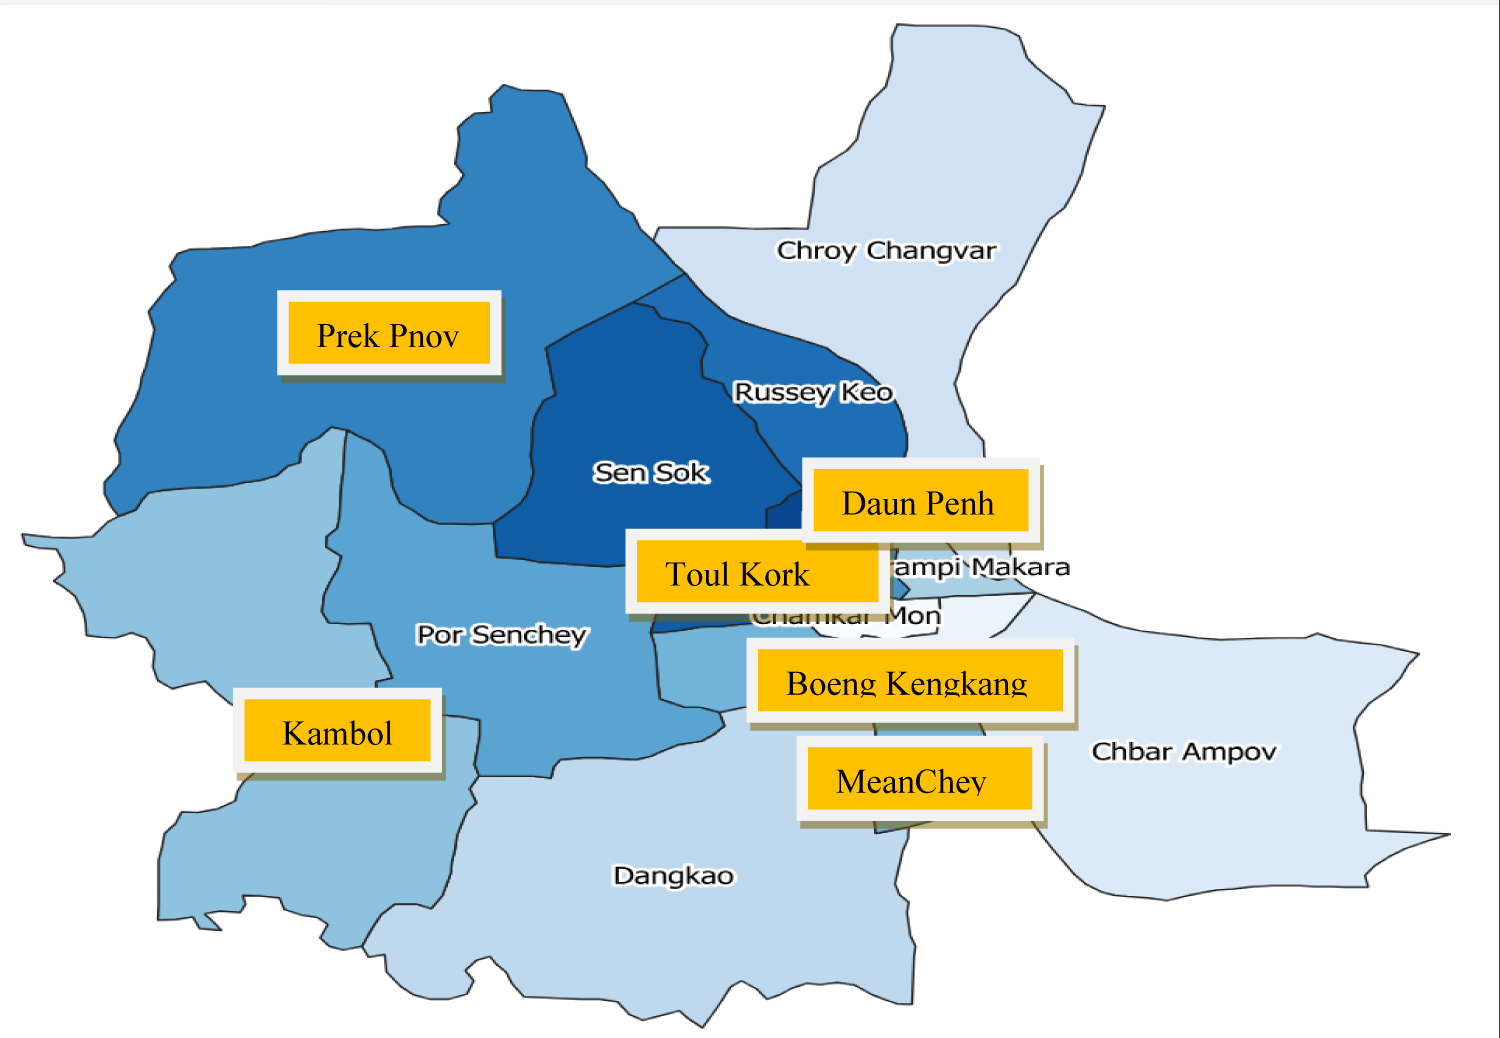
Figure 2: Map of Phnom Penh.
Data collection
Preliminary data: To gather information on the current state of solid waste management and to understand the challenges of urban solid waste management in the urban and peri-urban of Phnom Penh, the team used two different methods:
➢ Interview
The team prepared questionnaires, and the group selected the sample according to the number of families calculated according to the Taro formula. Key Informant Interview was conducted for the Phnom Penh Solid Waste Management Authority, the Department of Solid Waste Management (MoE), the Khan Administration, the garbage collection companies, and workers to obtain important data related to urban SWM. This interview focuses on information related to the management, storage, collection, and transportation, disposal of collection fees, and the structure of SWM, as well as the management strategies and plans of the institutions involved in SWM.
➢ Observation
In this study, the team also used another method to collect data related to the general condition of the study area, namely, direct observation. For this live survey, the team observed some points such as:
- Garbage storage area for people waiting for a truck to collect
- Collection efficiency (To know if there is any residue left after the truck is collected and if there is any liquid leaking from the truck)
Equipment used during collection
- Behavior of garbage collection workers regarding litter storage.
Secondary data: For secondary data related to the research topic, the team collected information from the Internet, such as the 2019 census book and other relevant documents. In addition, the team collected data from the Ministry of Environment (legally bound documents, laws, regulations, and policies on solid waste management in Cambodia and the 4th State of Environment Report) PPCH’s Guidelines on waste management in Phnom Penh and Map of waste management areas in Phnom Penh Khan administration and garbage collection companies.
Data analysis
Data analysis is an important study method used to analyze information obtained from interviews and observations. Data obtained from interviews and surveys were analyzed qualitatively and quantitatively using Microsoft Excel and SPSS. Microsoft Excel 2019 is used for drawing diagrams and graphics from analysis in SPSS 28.0.1.1. SPSS software is used to make descriptive statistics and analyze quantitative data such as:
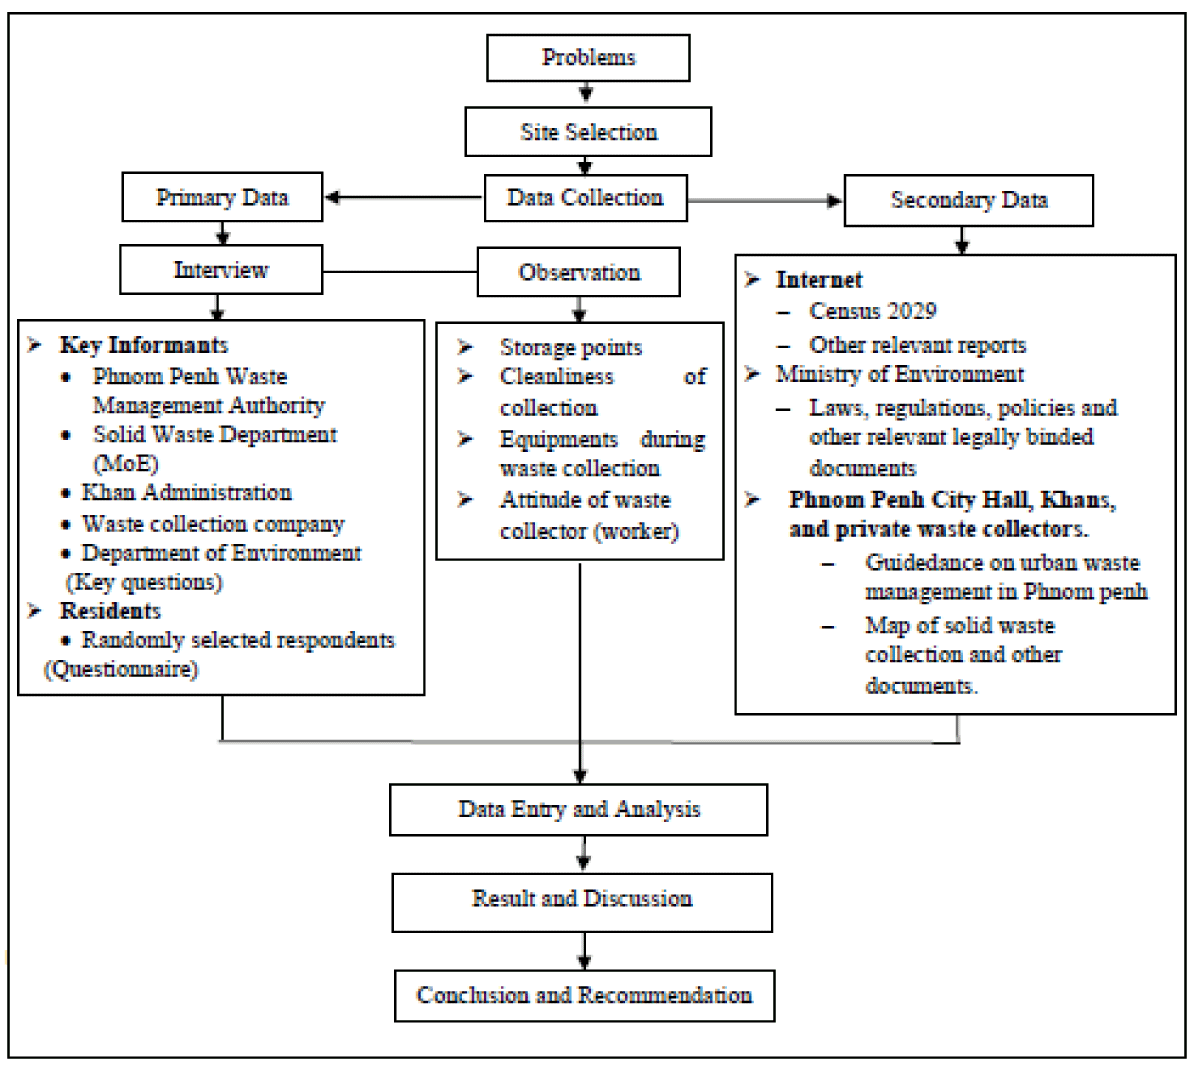
Diagram 1: Brief Diagram of Research Method.
- Average: How many times a company collects waste per day, the level of people's income, and the cost of waste collection services
- Frequency: solid waste management methods, level of awareness, and factors influencing the effectiveness of waste management.
Crosstab: To determine the number of frequencies and percentages that one variable interacts with another variable during analysis.
Collection coverage and payment fee
The results of the study show that the people living in urban and peri-urban are using waste collection and transportation services in almost every household, the number of people using the collection service is about 97.57%. 79.5% are willing to pay the waste collection fee and 20.5% are not willing to pay the fee, and the current price is USD2.5 for a normal household from 2021 and before 2021 was only USD1/household. The increase in payment fees also affected payment efficiency which parallelly affected the waste collection rate.
Waste packaging, discharging, and separating
Most people use plastic bags followed by waste bins (plastic, bamboo, etc.) for packaging their waste before collection as it is free (get free from the market during buying food) and easy to use causing the amount of plastic bags to be high (Figure 3). Furthermore, Single-Use Plastic (SUP) also contains in high proportion.
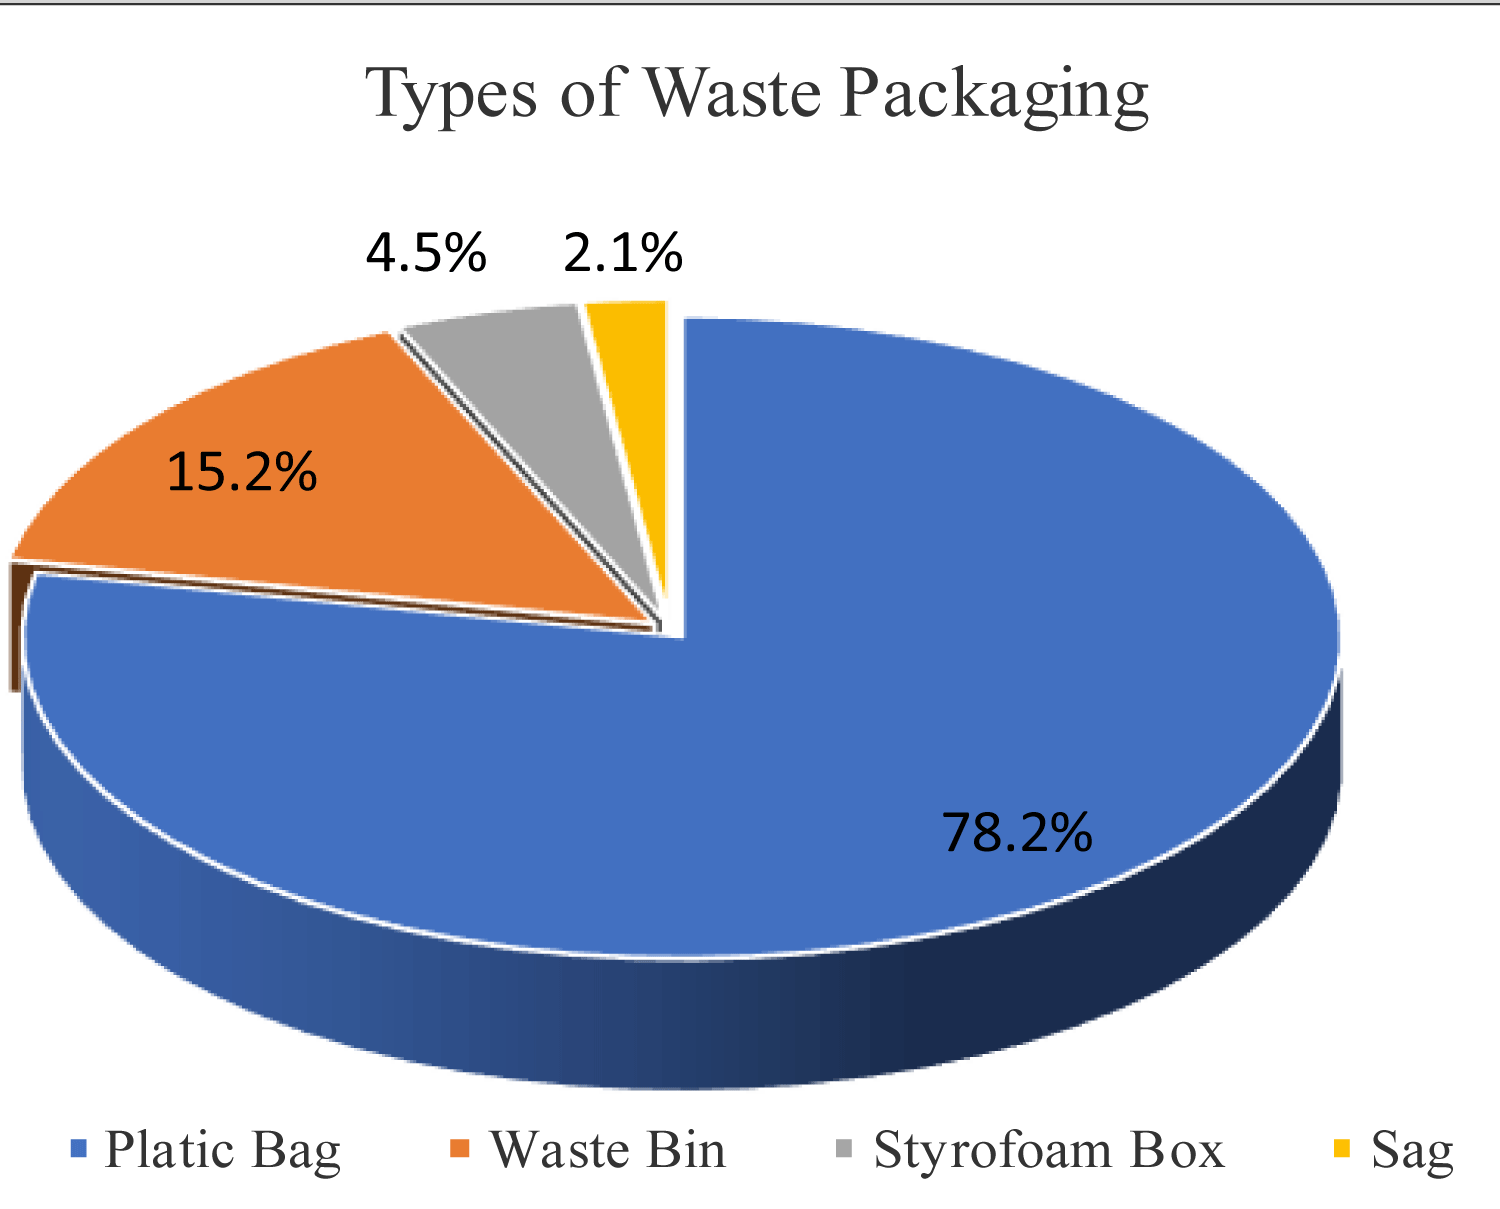
Figure 3: Types of waste packaging before discharging.
In general recyclables such as aluminum can, steel, carton board, and some kinds of plastic bottles were sorted for sale as they are marketable value except plastic bag, glass bottles, and others such as food waste remaining high. In general, the non-separation rate is high for both urban and peri-urban (Figure 4), so, recycling activities and programs play an important role in minimizing the waste volume.
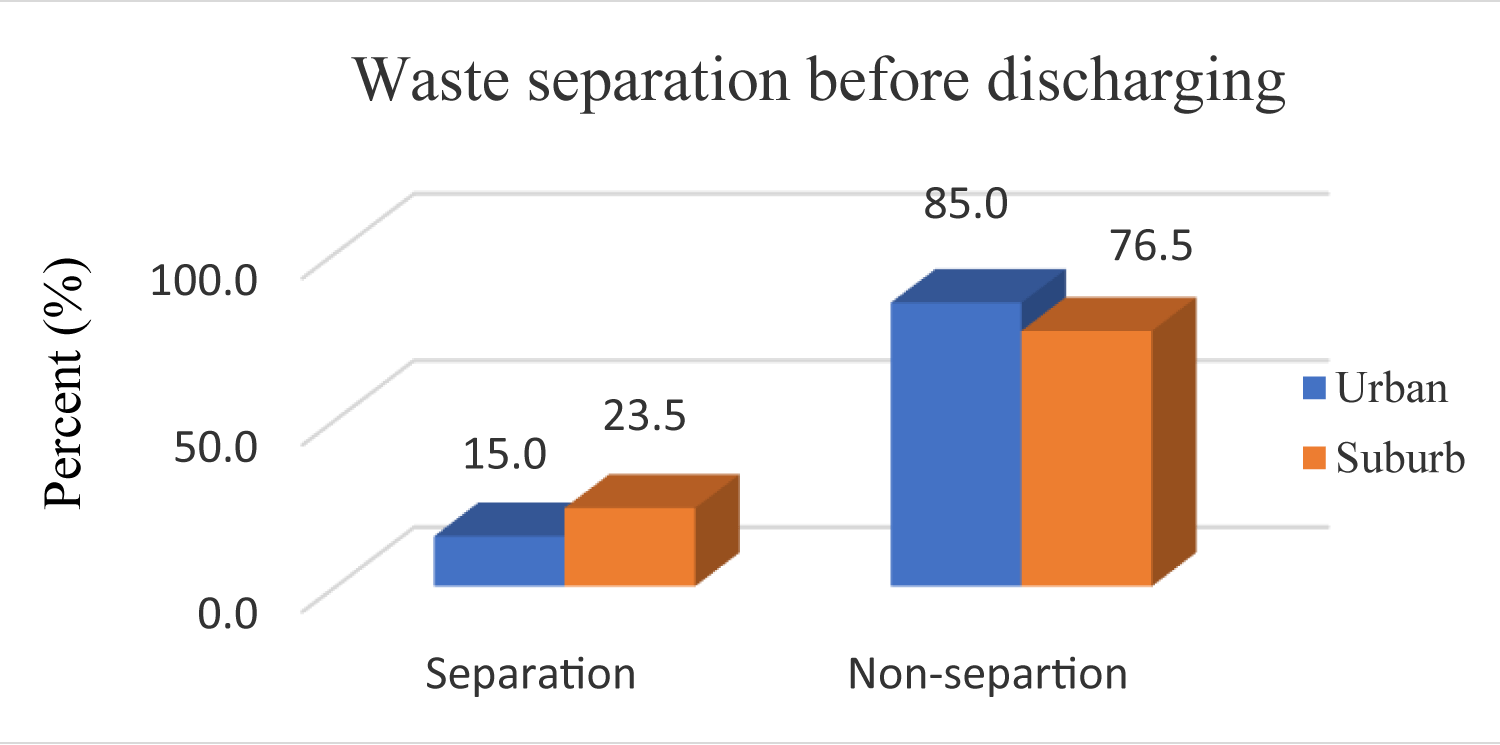
Figure 4: Waste Separation before discharging.
Figure 5 shows the frequency of waste collection for urban and peri-urban. Urban received better service compared to peri-urban as it is closer and easier to collect due to the better infrastructure and participation including a high number of commercial establishments. However, the service provided for peri-urban is high for collection every two years (Figure 5).
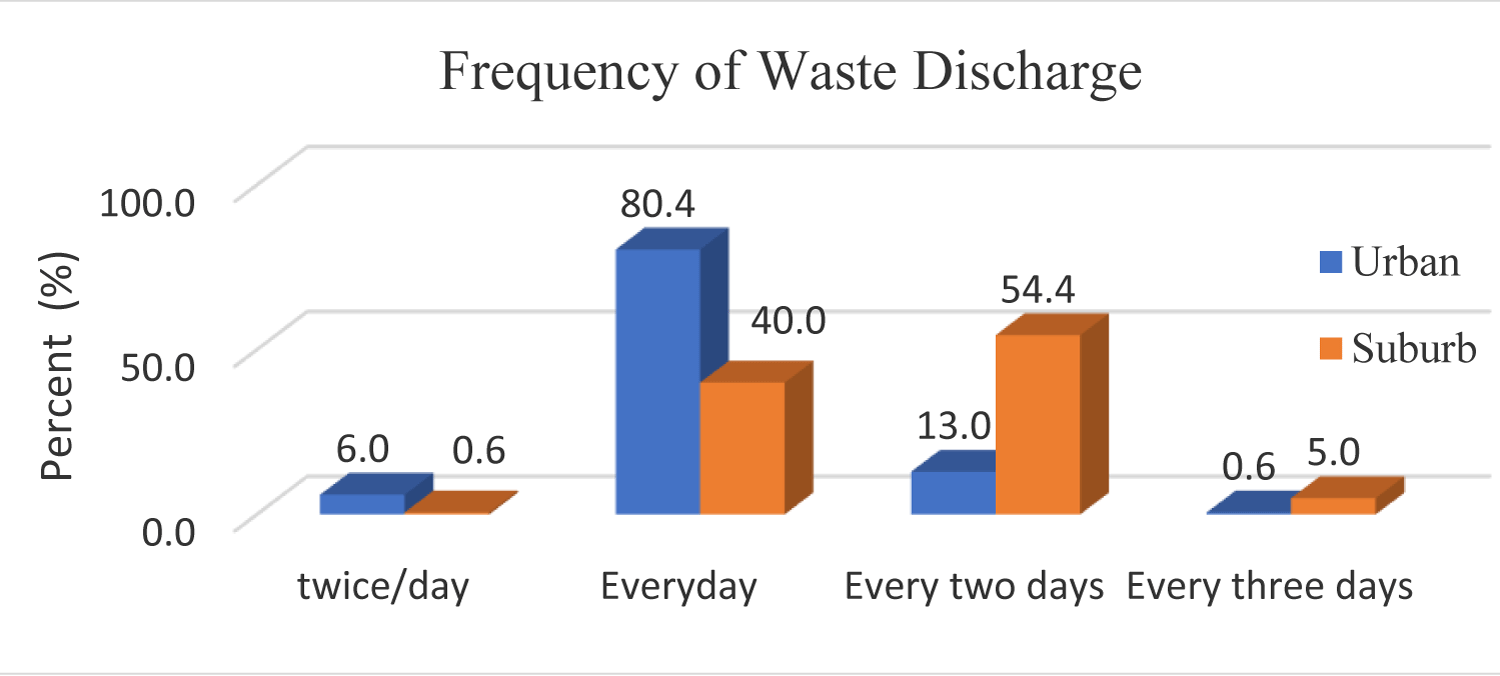
Figure 5: Frequency of waste discharge.
Collection time, fee, and level of satisfaction
Figure 6 shows the waste collection time, it seems a regular time is a much better time to collect the waste from door to door. It is only 9% for irregular collection so it has a lot of improvement compared to the previous operation.
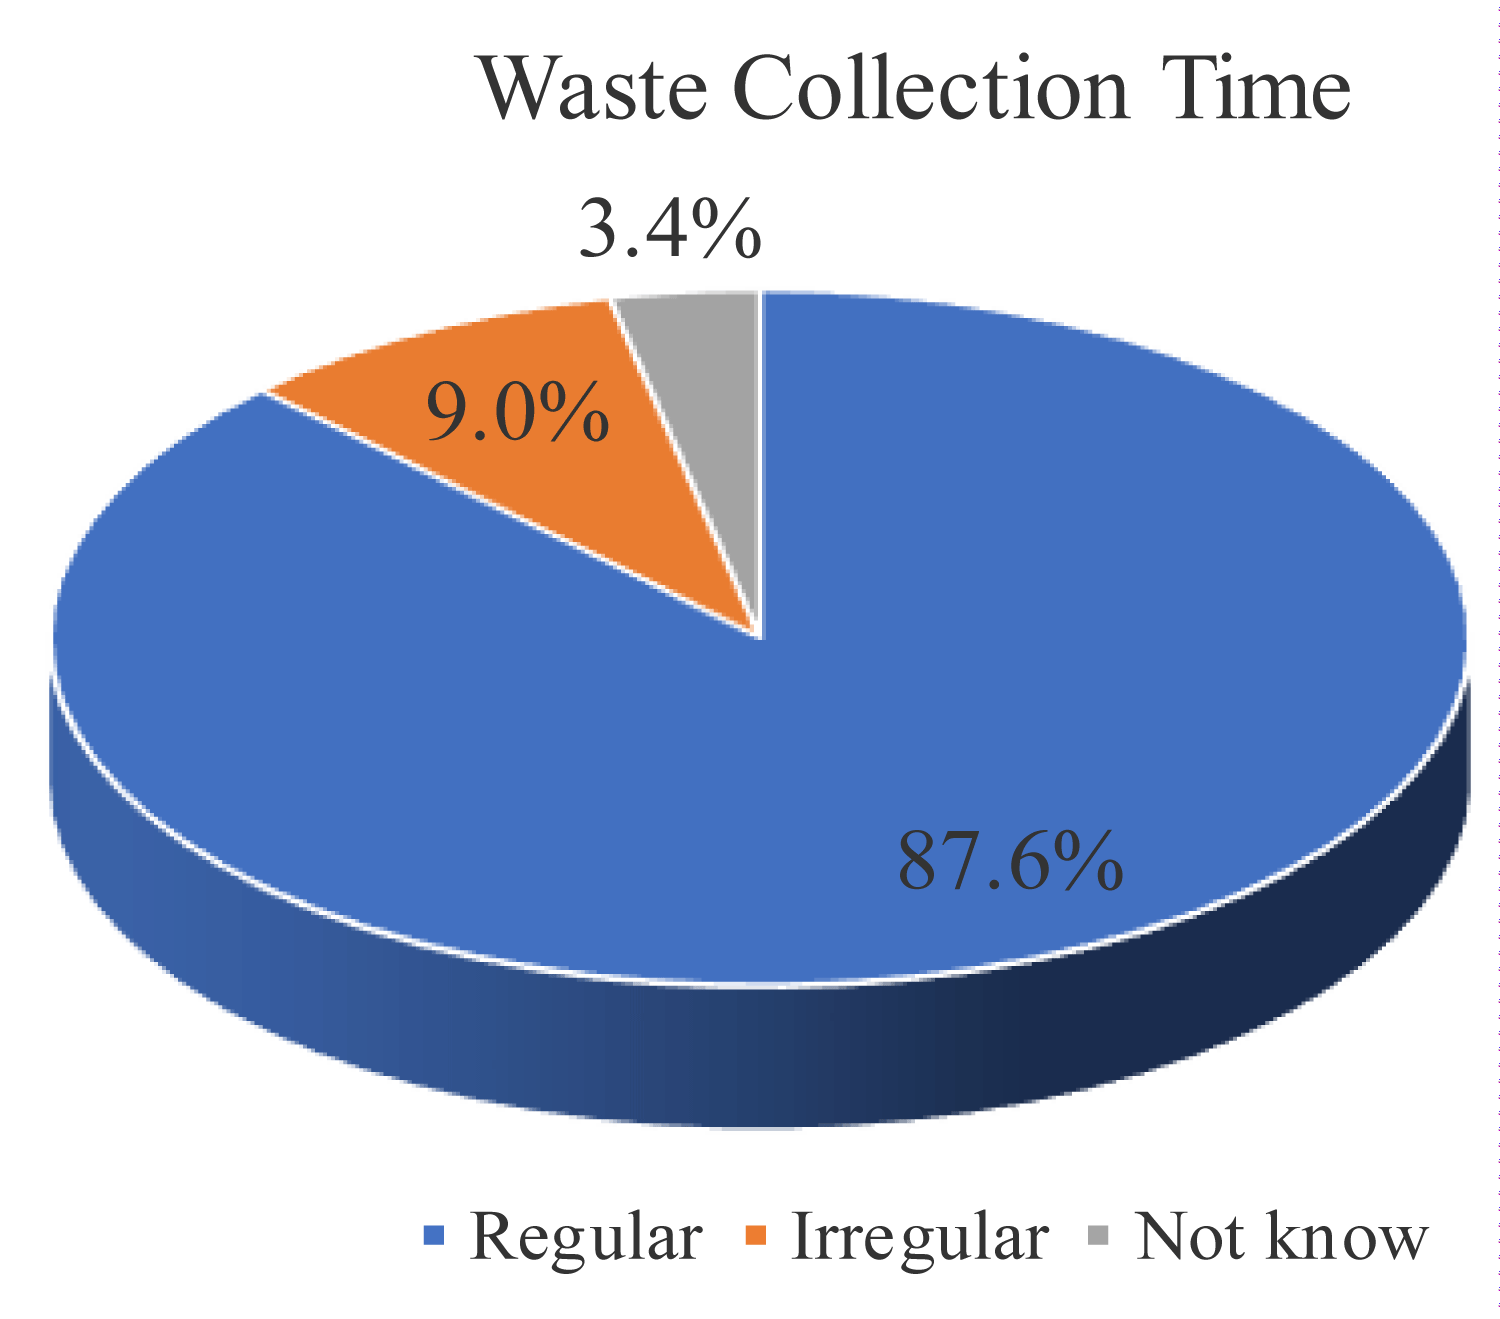
Figure 6: Efficiency of waste collection time.
Payment for waste collection fees is also challenging as users are unwilling to pay the fee. However, fee payment is still high (92%) for urban while peri-urban is low (68%) (Figure 7). So, modification of the fee payment strategy needs to be considered. Low waste collection fees affect the effectiveness of SWM.
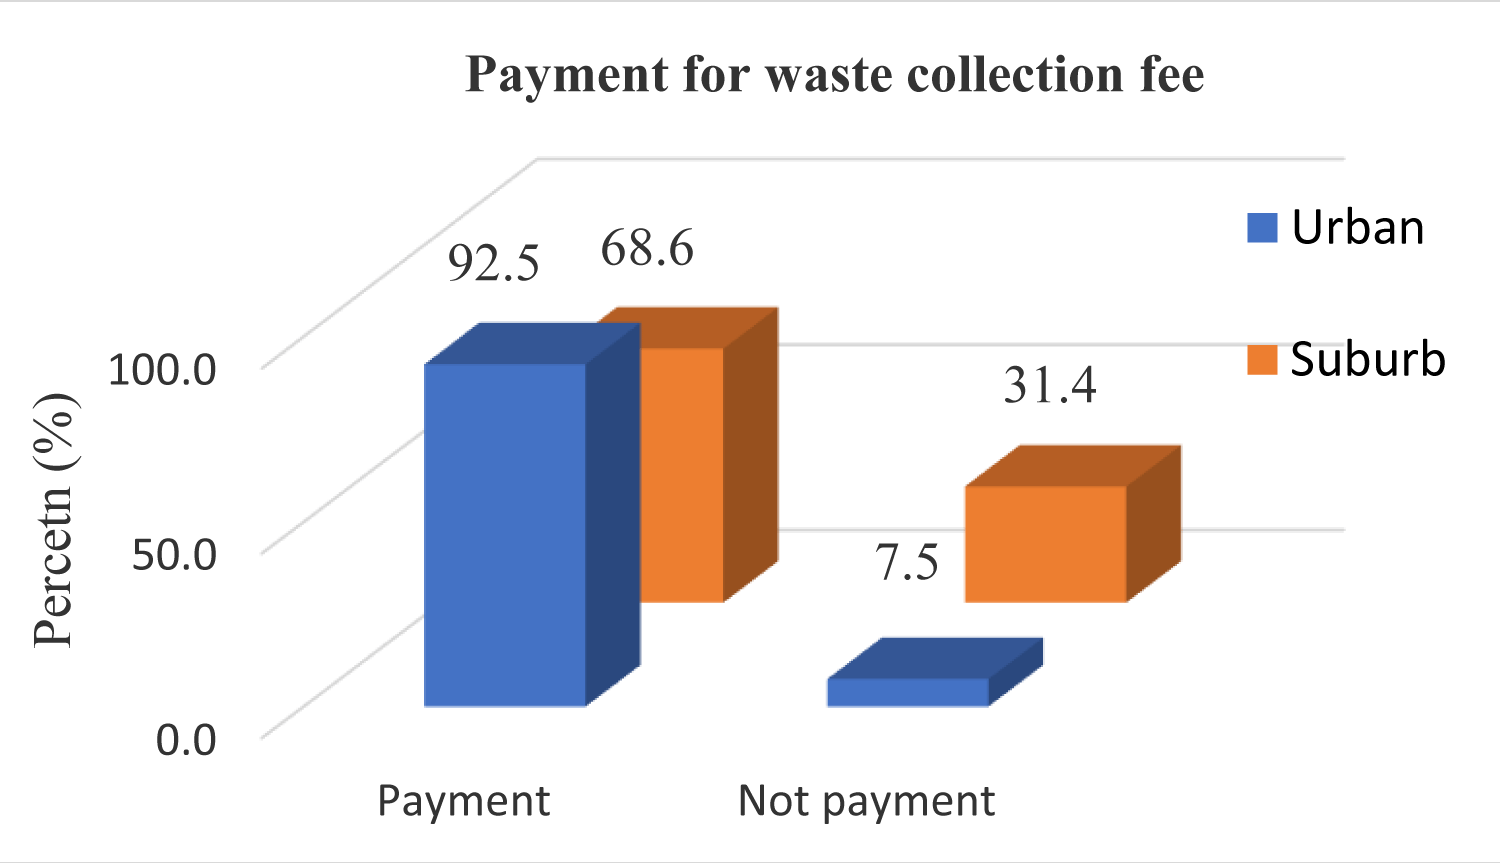
Figure 7: Willingness to pay for waste collection fee.
The satisfaction of waste collection services for both urban and peri-urban is very high accounting for more than 90%. It is indicated that the improvement of the waste sector has changed in a positive manner. While in 2014 the level of satisfaction and dissatisfaction was 15% and 55%, respectively [8] (Figure 8). So, it means that the improvement of solid waste collection is very appreciated.
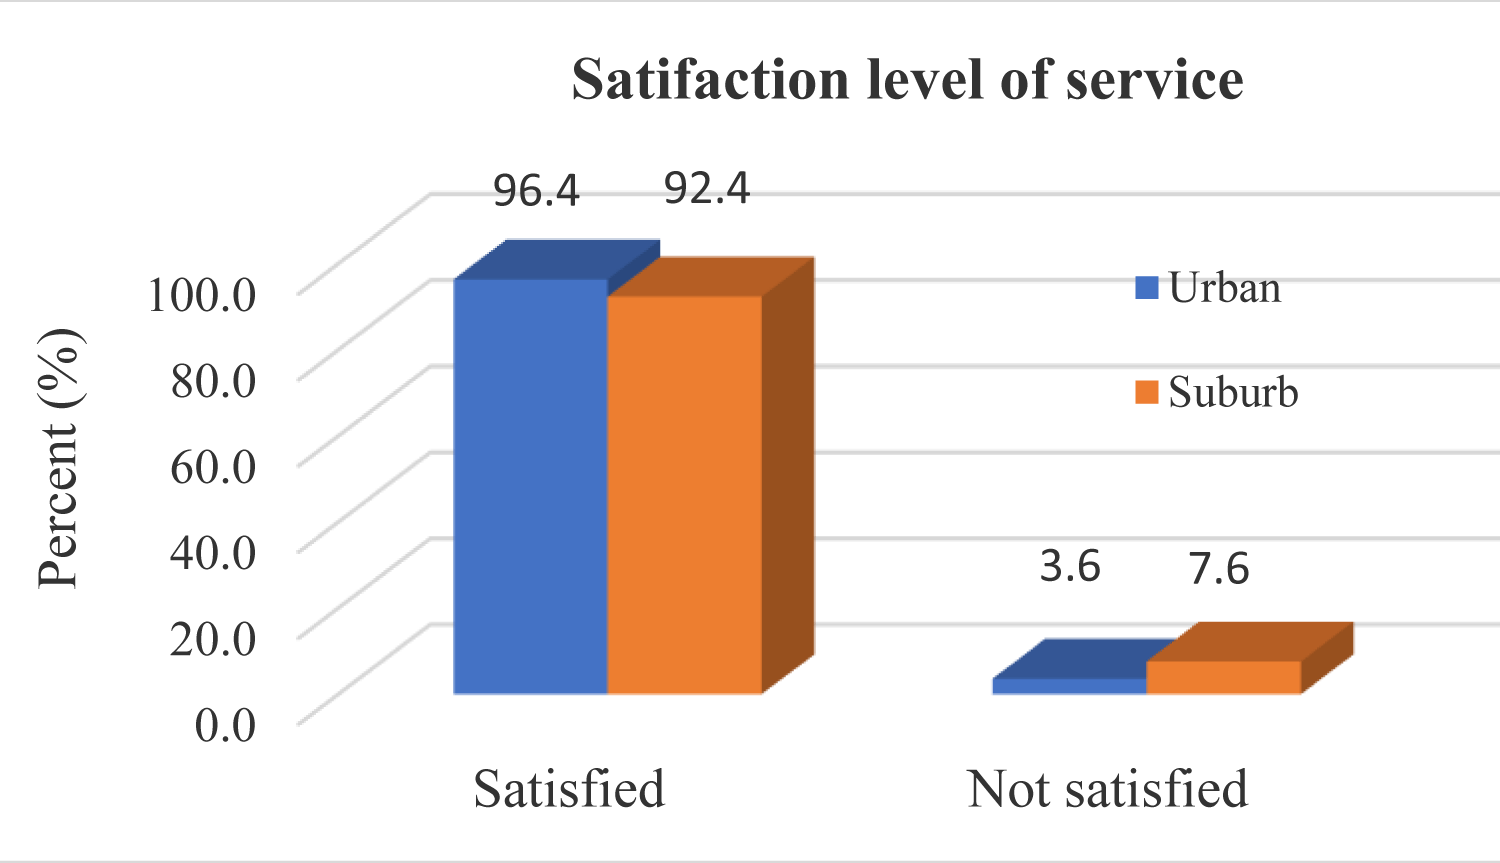
Figure 8: Satisfaction of waste collection services between urban and suburb residents.
Challenges in waste management in urban and peri-urban
Now, after the reform, SWM in Phnom Penh is less challenging, however, the challenges still remain such as financial issues (low payment), road infrastructure, public participation, landfill (the current one is full but still used due to the new one is not yet ready) and then like. According to the result, SWM in the urban and peri-urban have several challenges as follows:
Urban: People throw waste before trucks to collect for a long time, making scavengers and tearing bags making it messy and disorderly. In some market areas, there is no proper waste storage place yet, which causes a lot of waste piles scattered all over the road. Some rental houses do not have proper bins. Problems of unregulated parking on both sides of the road affect the cleaning, collection, and transportation of waste, especially night waste collection in Boeung Keng Kang and Chamkarmon districts. A large number of construction sites do not properly pack and store construction waste.
Peri-urban: Most people do not yet understand the importance of waste separation due to limited awareness and appropriate facilities− People release waste at the wrong time set by the company to collect − In peri-urban such as Khan Chbar Ampov, improper waste disposal caused by limited understanding of many poor communities on SWM. Mobile vendors dump their waste on vacant lots and private land, forming an anarchic garbage depot, especially at night time (suburbs are full of vacant land). Some road infrastructure in the suburbs is still limited, which makes it difficult for waste collection, cleaning, and transportation services (narrow, with power lines, flooded during the rainy season). Peri-urban is rich in factories, which are a major source of waste, making it difficult to manage waste, and some of it is thrown away in a disorderly manner. Some piles of rubbish continue to exist despite education disseminated by the authorities because the peri-urban are crowded with passers-by [9-16].
The results show that Phnom Penh is currently experiencing economic and population growth, resulting in an increase in the amount of waste generation. Accounting for 3,600 tons/day. 97.5% of the people in the urban and peri-urban used services, of which, about 95% for the urban and 80% for the peri-urban. The waste collection situation in Phnom Penh has changed, with Zone 1 owned by 800 Super, Zone 2 owned by Mizuda, and Zone 3 owned by CINTRI, starting July 2021 (before CINTRI). Plastic bags are commonly consumed instead of bins, triggers, and sags to store waste without any sorting before discharge. 79.5% of the people are willing to pay the waste collection fee. The collection fee is USD2.5 for a normal non-business household and it was only USD1/household before the reform. After the three companies went into operation, it was observed that the amount of waste collected, transported, and dumped on the site increased because each company had more ability to collect and transport due to more equipment, active workers, and public participation. The amount of waste collected and dumped at the landfill was 1,294,426 tons/year as reported by PPWMA in 2022. It is also found that the congestion problem is greatly reduced and the company collects regularly on a regular basis, except on rainy days. It is concluded that the current situation of SWM in Phnom Penh is much better in terms of cleanliness, collection time, transportation, and so on. Covering almost all households in the urban and peri-urban, the participation of people in packing and storing garbage has also increased.
Overall, the current situation of SWM in Phnom Penh city is getting much better after changing from monopoly to oligopoly (3 collection companies). However, many challenges persist such as sanitary landfills (final disposal) as open dumps are in operation, even managed landfills constructed in some provinces but the operation is still limited due to the lack of experience and financial support.
- MoE. The 4th State of Environment Report. General Department of Environmental Knowledge and Information, Cambodia. 2021.
- PPCH. Phnom Penh Capital Hall. Facts. Phnom Penh Capital Hall. 2023. https://phnompenh.gov.kh/en/phnom-penh-city/facts/
- National Institute of Statistics Ministry of Planning. Census 2019. National Institute of Statistics. 2019. https://www.nis.gov.kh/nis/Census2019/
- Royal Government of Cambodia (RGC). National Strategic Development Plan (NSDP) 2019-2023. 2019.
- Hul S, Kuok F, Soy T. SW generation and life lifespan with credible growth forecasts waste generation, volume, and composition. Phnom Penh: The Asia Foundation November 2016 Conference: Regional Conference on Chemical Engineering at: Universiti Teknologi Malaysia (UTM), Kuala Lumpur, Malaysia. 2015; 56.
- Bandith S, Fujiwara T. Municipal Solid Waste Characterization and Recycling Potential in Phnom Penh City, Cambodia. Faculty of Environmental Science and Technology, Okayama University (Study only 3 kinds of Waste: Food/ Organic, Plastic, and Textile). 2016.
- Mongtoeun Y, Fujiwara T , Vin S. Household Solid Waste Generation and Socioeconomic Factors in the Capital City of Cambodia. International Journal of Environmental Sciences &Natural Resources. 2019; 2572-1119.
- Cambodia: Phnom Penh (city districts and communes)-population statistics, charts and map. 2019. https://www.citypopulation.de/en/cambodia/phnompenh/admin/
- A guide for improving municipal solid waste management and promoting urban organic waste utilization in Lao PDR (English version). Asia-Pacific Network for Global Change Research. 2012. https://www.apn-gcr.org/publication/a-guide-for-improving-municipal-solid-waste-management-and-promoting-urban-organic-waste-utilization-in-lao-pdr-english-version/
- State of Waste Management in Phnom Penh, Cambodia CCET. 2018. https://ccet.jp/publications/state-waste-management-phnom-penh-cambodia.
- JICA. The Study on Solid Waste Management in the Municipality of Phnom Penh: final report. Kokusai Kogyo Co., Ltd.2005.
- PPCA, IGES, Nexus, UN Environment, & CCCA. Phnom Penh Waste Management Strategy and Action Plan 2018-2035. Phnom Penh, Cambodia. 2018.
- PPDoE. Presentation on Phnom Penh Municipality of Phnom Penh for Phnom Penh Green City Strategic Plan, on February 2016. Phnom Penh: Department of Environment. 2016.
- The Asian Foundation/Institute of Technology of Cambodia). Working Politically in Practice Series, Case Study No. 8. reforming solid waste management in phnom penh. 2016.
- UNEP. Developing Integrated Solid Waste Management Plan: Training Manual. 2009; 1: 1-77.
- Khmer Guidelines on Solid Waste Management in Phnom Penh. Phnom Penh Capital Hall. 2021.http://phnompenh.gov.kh/news-press-releases/post/ann16921e/