
More Information
Submitted: March 13, 2023 | Approved: April 12, 2023 | Published: April 13, 2023
How to cite this article: Moayeri MS, Hosseini SA, Nani M, Rabieifar H, Asadpour J. Evaluation of factors affecting the quality of luxury residential buildings using the fuzzy BWM method. Ann Civil Environ Eng. 2023; 7: 007-013.
DOI: 10.29328/journal.acee.1001049
Copyright License: © 2023 Moayeri MS, et al. This is an open access article distributed under the Creative Commons Attribution License, which permits unrestricted use, distribution, and reproduction in any medium, provided the original work is properly cited.
Keywords: Quality; Prioritization; Luxury residential buildings; Fuzzy BWM method

Evaluation of factors affecting the quality of luxury residential buildings using the fuzzy BWM method
Marziyeh Sadat Moayeri1, Seyed Azim Hosseini2*, Mehdi Nani3, Hamidreza Rabieifar3 and Jafar Asadpour4
1PH.D Student, Department of Civil Engineering, Islamic Azad University, South Tehran Branch, Tehran, Iran
2Associate Professor, Department of Civil Engineering, Islamic Azad University, South Tehran Branch, Tehran, Iran
3Assistant Professor, Department of Civil Engineering, Islamic Azad University, South Tehran Branch, Tehran, Iran
4Assistant Professor, Department of Mathematical Chemistry, Islamic Azad University, South Tehran Branch, Tehran, Iran
*Address for Correspondence: Seyed Azim Hosseini, Associate Professor, Department of Civil Engineering, Islamic Azad University, South Tehran Branch, Tehran, Iran, Email: [email protected]
The construction sector consists of a collection of activities related to buildings and engineering constructions of all kinds. It is the close relationship between this sectors with other economic sectors, which distinguishes it. Therefore, it is an important indicator of the movement of the national economy, but this sector faces major risks, especially in the construction of luxury residential buildings, and these risks may affect the implementation of the project and may lead to increase costs, affect the quality and sometimes delay delivery. This study was carried out to evaluate the factors affecting the quality of luxury residential buildings in Iran using the fuzzy best-worst method (fuzzy BWM). The BWM method provides a consistent structural comparison of factors through best and worst criteria. And this method extended using a fuzzy set to address the ambiguity from the decision-maker’s judgment. The evaluation consists of five criteria: Strength and stability, physical comfort and mental peace, visual proportions and beauty, safety, security and environment, and welfare and health. To determine the fuzzy criteria’ weights, the nonlinearly constrained optimization problem was applied. The result indicated that the best and the worst criteria were Visual proportions and beauty and welfare and health.
Globally, the building construction sector is considered to be an essential sector on which the development of a country depends [1]. The construction industry has too often in the past been discredited by bad propaganda, resulting from sometimes dramatic features of both the design and the construction of its products. The industry in every nation can best be access base on its stakeholders, contractors, thus the professionals (project manager, architect, engineers, quantity surveyor), and clients. The need for best practices in the field has been a cost to be paid by stakeholders to attain the ultimate in quality performance based on the agreed characteristics [2]. Quality is a universal phenomenon that has been a matter of great concern throughout recorded history [3].
Quality systems and quality are topics that have been receiving increasing attention worldwide. The product in any industry should be created to a required standard, one that provides customer satisfaction and value for money. Achieving the quality of the finished product in the building construction is very critical. The level of success of the construction industry considerably depends on quality performance. Improving quality in construction is one of the important tasks that should be done quickly.
According to Philip [4], construction management is traditionally broken into four primary categories, namely: quality, schedule, cost, and safety. The last three are well understood and clearly defined, but the term quality has been secret. When a project experience poor quality, the term is less clear and can be understood in a variety of ways depending on one’s viewpoint. It is important for construction specialists to have an understanding of the meaning of quality and quality management in construction work to achieve a successful project delivery [4].
Quality in the construction industry refers to the degree of excellence and strict adherence to the standards. It can also be defined as the achievement of acceptable levels of performance from construction activities. This performance would be achieved when the activity meets or exceeds the requirement of the client or the owner. The quality of any product or service is attained when it conforms to the desired specifications. Building customers often want the best possible quality but are not prepared to pay for it. Cornick (1991) emphasizes that the need to manage quality in a briefing, designing, and specification phases of a building project, rather than trying to just control quality in the construction phase, stems from the preposition that prevention is better than cure.
Construction firms must continuously improve their competitiveness to achieve success in the market, and this is possible through better implementation of construction projects. That despite all the efforts, by the stakeholders in the construction industry to sensitize and educate the construction practitioners on the need to strictly join to the essential standard for quality when carrying out their construction works, so as to provide value for money and meet customer satisfaction, the menace of pour quality delivery has been on the increase.
This research is carried out to identify the factors that have an adverse effect on the quality of luxury residential buildings. Identifying the potential serious factors will however not dispel the problem of quality but to a large extent, help the project team avoid such negative factors.
The construction industry plays a serious role in the development and achievement of the goals of society. The performance of the development industry is suffering from national economies. Therefore, performance is related to many factors such as client satisfaction factor, quality factor, the time factor, cost factor, health and safety factor, and productivity factor.
David Arditi and H. Murat Gunaydin [5], carried out a study to identify the factors that affect process quality. Generic factors that affect process quality are management leadership in promoting high process quality, management Commitment to continuous quality improvement, efficient teamwork to promote quality issues at the corporate level, quality training of all personnel, and effective cooperation between parties taking part in the project. Industry-specific factors are Drawings and specifications that are consistent, contractors and designers that are selected on competency, relationship practices between the parties that are effective, and Inspection of quality on the construction site [5].
Seelay (1996) emphasizes the important role of qualitative issues and states that it has been estimated that as many as one in four workers produce nothing at all because they spend all day modifying the mistakes made by others. 6-15% of construction cost is found to be wasted due to the rework of defective components detected late during construction and 5% of construction cost is wasted due to the rework of defective components detected during maintenance [6-8].
Abdol R. Chini and Hector E. Valdez [9], these people conducted a study called: “ISO 9000 and the US construction industry”. The outcome is that the construction industry in the United States has generally retarded behind other industries and other countries in the acceptance and implementation of ISO 9000 standards. After analyzing the gathered data, they concluded that ISO 9000 is a suitable and effective tool for construction firms in the United States, although several obstacles affect its implementation and acceptance among construction organizations [9].
K. N. Jha & K. C. Iyer [10], their paper identified the factors affecting the quality performance in construction projects and help to suggest possible corrective measures for improving the quality. From the study, the critical success factors obtained were: monitoring and feedback by project participants, project manager’s competence, top management’s support; owners’ competence and interaction among project participants; and. The factors that adversely affected the quality performances of projects were: faulty project conceptualization, hostile socio-economic environment, faulty project conceptualization, conflict among project participants, harsh climatic conditions, the aggressive competition during tendering, and PM’s ignorance & lack of knowledge [10].
It is now identified that in the construction industry, the lowest price can cost more in the long run. According to Ashworth (2006), there is frequently poor management and supervision, and a study in U.k. indicated that about [11]:
a) 50% of faults originate in the design office.
b) 30% on-site.
c) 20% in the manufacture of materials and components.
Tengan C [12], when he studied the quality assurance procedures of some selected construction companies, he identifies a lack of technical and professional expertise and resources to perform the task, lack of employee commitment and understanding, lack of education and training to drive the improvement process [12].
Michael and Adegbenjo (2008), recognized and modeled the factors affecting the quality of building projects. They contain site staff characteristics, site layout specifications, quality control system, materials management system, income level and wages of labor, design documents, preparing and using shop drawings, labor experience, owner’s characteristics, and equipment management system [13].
Shri BSP, et al. (2009), identified the factors affecting the cost and quality of construction projects, which include: poor financial control on site, previous experience of the contractor, incorrect planning, fraudulent practices, and kickbacks; Level of competition; Lack of coordination between designers and contractors; wastage on-site; and frequent design changes as factors affecting quality performance and Number of competitors.
Philip [4], concluded in his research that the construction industry needs to experience two correct paradigm shifts; one to construction business perspective from thinking in quality compliance mode to actual quality performance mode, and the other is to move the industry from resources spent on quality non-conformance to resources spent on quality conformance [4].
Omran, et al. [14], showed that the success of a construction project depends on its performance, which is measured based on customer satisfaction, timely completion within the budget, and required quality standards [14].
Zhao and Liu [15], Studied indicate in Swaziland that quality affects factors of construction projects. Data obtained through the use of a questionnaire distributed to architects, construction managers, engineers, contractors, and quality surveyors as well as project and the after-analysis result shows the most quality performance affecting factors of construction projects in the study area are lack of communication, unskilled and inefficient contractors, Down supervision of the site, poor scheduling and planning, Lack of Knowledge, Skill, and tanning of construction workmen [15].
Dr. Abdulsalam Zidan [16], summarizes his research on factors affecting design quality in construction. Poor design is the major factor that reduces the entire performance of the construction project. The main factors are insufficient overall design time, method of selecting the designer, lowest price offer, lack of documentation, and changes in client requirements [16].
It is asserted that the majority of construction companies all over the world face a lot of many problems and challenges such as delays, workmanship defects, and cost overruns in supplementing their construction projects for the past three decades [17]. As it is known, Construction projects and quality are irresolvable parts of each other. There the modern construction world requires construction firms to guarantee the quality of their product to their customers. In fact, the quality of construction projects and project success can be regarded as the fulfillment of expectations (i.e. the satisfaction) of the project participants.
Laiche, et.al. [18] and Hosseini and Turhan [19], have studied construction projects quality affecting factors in the Ghaza line, The extremely important affecting factors were identified as Site staff experience, Design documents, Site layout characteristics, Contractor’s financial power, Construction materials availability, Using Controlling systems, Subcontractors, and Environment for political [18,19].
From the literature review, it is evident that quality management has great research potential and not much has been actually implemented in this Area. FBWM is applied to find the best and worst criteria affected by using the quality management practices and the interrelation of all other criteria. There are various parameters that lead to quality management in luxury residential buildings, which are summarized in Table 1 according to the study of Moayeri, et al. Each parameter is given an acronym that will later help in evaluation and analysis using FBWM.
| Table 1: Parameters Leading to quality management. | ||||
| No | Criteria | Acronym | Sub- criteria | Acronym |
| 1 | Strength and stability | SS | Strength of building structure | SBS |
| Useful life of the building | UB | |||
| Durability and quality of materials | DQB | |||
| Appropriate resistance to fire and incoming forces such as earthquake loads | RFE | |||
| 2 | Physical comfort and mental peace | PM | Air conditioning | AC |
| Internal circulation | IC | |||
| Appropriate dimensions and sizes of spaces | ADS | |||
| Visual, spatial and auditory privacy | VSA | |||
| The prestige of the neighborhood and the gentry of the residents | PG | |||
| 3 | Safety, security and environment | SE | Sensors, cameras and 24-hour security guard | SCS |
| Smart energy control systems | SE | |||
| Smart maintenance and repair systems | SM | |||
| Smart fire alarm and extinguishing and Shelter from natural disasters | SFS | |||
| 4 | Visual and aesthetic proportions | VP | Cleanliness at the end of the work and the harmony of color, light and materials | CLM |
| Desirable perspective and green space | DP | |||
| Special exterior and luxurious lobby | SEL | |||
| Modern and expensive materials and equipment | MME | |||
| Unique decorations and layouts and the ability to use different spaces | UD | |||
| 5 | welfare and health | PH | Access to city facilities | AF |
| Entertainment and health facilities | EH | |||
| Diversification in sub-services | DS | |||
The FBWM is a multi-criteria decision-making mathematical instrumentation. An MCDM tool works by identifying the aim, choosing the parameters to excavate the aim, and the alternatives or paths that are taken to attain the aim. Numerical data is used which is gathered in form of surveys to solve the problem. Luxury residential buildings are taken as a case study for this research.
The best-worst method (BWM) proposed by Rezaei [20] is a multi-criteria decision-making tool [20]. This method selects the best and worst criteria and compares them with other criteria by calculating weights [21]. It is a pairwise comparison matrix method. The main profit of this method is that only two comparison matrices are formed, one for best and another for worst criteria. This helps to solve the problem in a regular structured way [22]. It is used in many real-world problems in various fields. The fuzzy Best-Worst Method (FBWM) is an advanced version of BWM and is based on triangular fuzzy numbers. The advantage of FBWM compared to BWM is that it contains fractions as well which gives more consistent results [23]. In the paper, to use the FBWM, the criteria are subdivided into sub-criteria to ease the calculation part. The criteria are Strength and stability, Physical comfort and mental peace, Safety, security and environment, Visual and aesthetic proportions, welfare, and health.
The calculation is carried out in the following steps:
Step 1: Assumption of best and worst criterion: The best and worst criterion is assumed out of the taken group at a time. From the criterion of Strength and stability, SBS and DQB; from the criterion of Physical comfort and mental peace, VSA, and PG; from the criterion of Safety, security, and environment, SCS and SM; from the criterion of Visual and aesthetic proportions, SEL and UD; from criterion welfare and health, EH and AF assumed as best and worst criteria, respectively. And among the criteria, Visual and aesthetic proportions and welfare and health are assumed as the best and worst criteria, respectively.
Step 2: Scaling of criteria: All the sub-criteria in their respective group are scaled according to the best and worst criteria of that group. Thereafter, criteria are scaled to each other. Scaling is carried out using the Fuzzy BWM Scale (Table 2).
| Table 2: Transformation rules of linguistic variables of decision-makers [23]. | |
| Linguistic terms | Membership function |
| Equally Important | (1,1,1) |
| Weakly Important | (0.67,1,1.5) |
| Fairly Important | (1.5, 2, 2.5) |
| Very Important | (2.5, 3, 3.5) |
| Absolutely important | (3.5, 4, 4.5) |
Step 3: Calculation of Fuzzy and Normalized weights: After scaling, fuzzy weights are calculated by solving the following equations assuming:
ξ* = (k*, k*, k*)
min ξ*
Subject to
Where,
lb, mb, ub = 𝐹𝑢𝑧𝑧𝑦 Weight of best criteria for lower, middle, and upper limit respectively
lw, mw, uw = Fuzzy Weight of worst criteria for lower, middle, and upper limit respectively
lj, mj, uj = Fuzzy Weight of criteria for lower, middle, and upper limit respectively
lbj, mbj, ubj = 𝐹𝑢𝑧𝑧𝑦 Preference score of best criteria w.r.t other criteria in lower, middle, upper limit respectively
ljw, mwj, uwj = 𝐹𝑢𝑧𝑧𝑦 Preference score of best criteria w.r.t other criteria in lower, middle, upper limit respectively
= 𝑁𝑜𝑟𝑚𝑎𝑙𝑖𝑧𝑒𝑑 Weight of criteria
Then the calculation of Fuzzy weights, and normalized weights are calculated by the formula.
Step 4: Calculation of consistency
Consistency is represented by Ksi*. Its formula is as shown below
The consistency index value for all variables is shown in Table 3 [23].
| Table 3: Consistency index (CI) for fuzzy BWM. | |||||
| Linguistic terms | Equally important (EI) | Weakly important (WI) | Fairly Important (FI) | Very important (VI) | Absolutely important (AI) |
| Variables | (1,1,1) | (0.67,1,1.5) | (1.5, 2, 2.5) | (2.5, 3, 3.5) | (3.5, 4, 4.5) |
| CI | 3.00 | 3.80 | 5.29 | 6.69 | 8.04 |
In this study, using the viewpoints of 15 experts, first in the main criteria and then among the sub-criteria of each criterion, the most important (best) and least important (worst) criteria were identified. And then, according to pairwise comparisons, comparing the best criterion relative to other criteria (BO) and other criteria compared to the worst criterion (OW) and solving the model in Lingo software, a definite weight was obtained for the criteria and sub-criteria according to the Tables 4-9.
| Table 4: Best-Worst value for the sub-criterion 1 (Strength and stability). | ||||
| SBS | UB | DQB | RFE | |
| Best SBS | (1,1,1) | (1.642,2.12,2.67) | (2.925,3.431,3.936) | (1.114,1.32,1.523) |
| Worst DQB | (1,1,1) | (1.1,149,1.303) | (1,1,1) | (1.611,2.095,2.681) |
| Fuzzy Weights | (0.382,0.129, 0.143) | (0.162,0.129,0.143) | (0.129,0.129,0.143) | (0.267,0.267,0.313) |
| Normalized Weights | 0.416 | 0.176 | 0.131 | 0.257 |
| Table 5: Best-Worst value for the sub-criterion 2 (Physical comfort and mental peace). | |||||
| AC | IC | ADS | VSA | PG | |
| Best VSA | (1.1,26,1.554) | (0.974,1.382,1.904) | (1.268,1.644,2.065) | (1,1,1) | (2.797,3.302,3.806) |
| Worst PG | (1.363,1.823,2.396) | (0.828,1.203,1.719) | (1.005, 1.32, 1.714) | (2.797,3.302,3.806) | (1,1,1) |
| Fuzzy Weights | (0.219,0.228,0.272) | (0.153,0.165, 0.217) | (0.175,0.177, 0.211) | (0.295,0.295, 0.354) | (0.102,0.102, 0.124) |
| Normalized Weights | 0.234 | 0.172 | 0.182 | 0.305 | 0.106 |
| Table 6: Best-Worst value for the sub-criterion 3 (Safety, security, and environment). | ||||
| CSC | SE | SM/td> | SFS | |
| Best CSC | (1,1,1) | (1.243, 1.689,2.229) | (2.925,3.431, 3.936) | (1.404,1.783,2.209) |
| Worst SM | (2.925,3.431, 3.936) | (0.874,1.149,1.491) | (1,1,1) | (1.09,1.32, 1.581) |
| Fuzzy Weights | (0.397,0.141,0.491) | (0.19,0.202,0.248) | (0.135,0.135, 0.155) | (0.208,0.225, 0.261) |
| Normalized Weights | 0.424 | 0.208 | 0.138 | 0.228 |
| Table 7: Best-Worst value for the sub-criterion 4 (Visual and aesthetic proportions). | |||||
| CLM | DP | SEL | MME | UD | |
| Best SEL | (0.874,1.26,1.778) | (1.565, 2.048,2.582) | (1,1,1) | (1.357,1.657,1.978) | (2.797,3.302,3.806) |
| Worst UD | (0.992,1.32,1.84) | (.0828,1.047,1.32) | (2.797,3.302,3.806) | (1.397,1.662, 1.945) | (1,1,1) |
| Fuzzy Weights | (0.165,0.217, 0.232) | (0.121,0.147, 0.151) | (0.299,0.362, 0.362) | (0.151,0.175, 0.175) | (0.103,0.125, 0.125) |
| Normalized Weights | 0.211 | 0.143 | 0.352 | 0.171 | 0.121 |
| Table 8: Best-Worst value for the sub-criterion 5 (welfare and health). | |||
| AF | EH | DS | |
| Best EH | (2.925,3.431,3.936) | (1,1,1) | (1.453,1.918, 2.467) |
| Worst AF | (1,1,1) | (2.925,3.431,3.936) | (0.948, 1.149,1.375) |
| Fuzzy Weights | (0.167,0.182, 0.182) | (0.48, 0.572, 0.61) | (0.222, 0.26, 0.277) |
| Normalized Weights | 0.18 | 0.563 | 0.257 |
| Table 9:Value of global weights | |||||
| SS | PM | SE | VP | PH | |
| Best VP | (2.257, 2.766,3.272) | (0.743,1.0,1.346) | (1.208,1.662,2.182) | (1,1,1) | (3.2, 3.705,4.208) |
| Worst PH | (0.806,1.047, 1.356) | (1.462, 1.94,2.469) | (0.874, 1.26, 1.778) | (3.2, 3.705,4.208) | (1,1,1) |
| Fuzzy Weights | (0.099,0.114, 0.116) | (0.27, 0.258, 0.207) | (0.14, 0.176, 0.192) | (0.31, 0.363, 0.363) | (0.094, 0.11, 0.111) |
| Normalized Weights | 0.112 | 0.252 | 0.173 | 0.354 | 0.108 |
The individual weight of factors is acquired by multiplying the normalized weight of each criterion by their respective global weight. Table 10 shows the weight of each criterion and Figure 1 shows the bar graph presentation of the weight of each criterion.
| Table 10: Weights of criteria and sub-criteria. | ||||
| Criteria | Weights | Sub-criteria | Calculation of Weights | Weights |
| Strength and stability | 0.112 | SBS | 0.416*0.112 | 0.0466 |
| UB | 0.176*0.112 | 0.0197 | ||
| DQB | 0.131*0.112 | 0.0147 | ||
| RFE | 0.275*0.112 | 0.0308 | ||
| Physical comfort and mental peace | 0.252 | AC | 0.234*0.252 | 0.059 |
| IC | 0.172*0.252 | 0.0433 | ||
| ADS | 0.182*0.252 | 0.0459 | ||
| VSA | 0.305*0.252 | 0.0769 | ||
| PG | 0.106*0.252 | 0.0267 | ||
| Safety, security and environment | 0.173 | SCS | 0.424*0.173 | 0.0734 |
| SE | 0.208*0.173 | 0.036 | ||
| SM | 0.138*0.173 | 0.0239 | ||
| SFS | 0.228*0.173 | 0.0394 | ||
| Visual and aesthetic proportions | 0.354 | CLM | 0.211*0.354 | 0.0747 |
| DP | 0.143*0.354 | 0.0506 | ||
| SEL | 0.352*0.354 | 0.1246 | ||
| MME | 0.171*0.354 | 0.0605 | ||
| UD | 0.121*0.354 | 0.0428 | ||
| welfare and health | 0.108 | AF | 0.180*0.108 | 0.0194 |
| EH | 0.563*0.108 | 0.0608 | ||
| DS | 0.257*0.108 | 0.0278 | ||
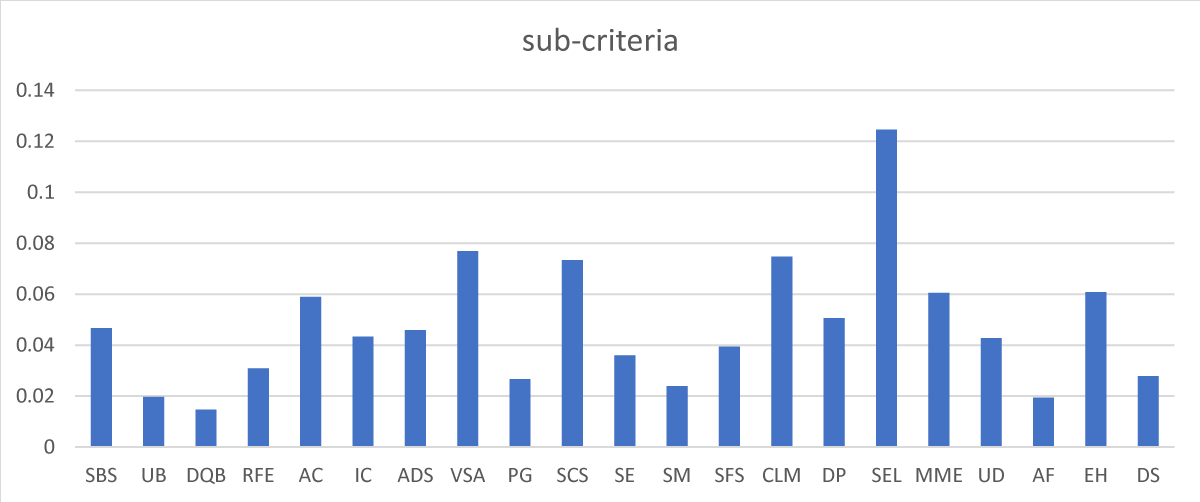
Figure 1: Weight of all sub-criteria by Fuzzy Best-Worst method.
Therefore, from Table 10 and Figure 1, the best and worst metrics affected by quality management are SEL and DQB, respectively, as shown in Table 11.
| Table 11: Fuzzy Best and Worst Sub-Criteria. | ||
| Best Criteria | SEL | 0.1246 |
| worst Criteria | DQB | 0.0147 |
The quality of luxury residential buildings has become a very complex issue in recent years due to conceptual changes. Better quality performance makes the construction of luxury residential building projects more successful. Quality is a fundamental component of customer satisfaction and sustainability. The necessity of achieving quality for the finished product in the building construction is very essential. The high cost of luxury residential buildings makes it necessary to ensure the quality of the finished product. In these buildings, quality performance is considered vital for customer satisfaction. In this study, it was studied the factors affecting the quality performance of construction projects. That can also be used to measure performance in construction projects. This will be a key move towards achieving best practices in order to overcome the quality performance problem in construction projects. A questionnaire-based survey was used to elicit the attitude of customers, contractors, and engineers toward factors affecting the performance of luxury residential building projects. The result from the FBWM shows that the best and worst criteria affected are visual and aesthetic proportions (0.354) and welfare and health (0.108) respectively. Among the 21 identified sub-criteria; A special exterior and luxurious lobby (0.1246), visual, spatial, and auditory privacy (0.0769), cleanliness at the end of the work and the harmony of color, light, and materials (0.0747), sensors, cameras, and 24-hour security (0.0734) and entertainment and health facilities (0.0608) are respectively effective factors in the quality of luxury residential buildings, that should be given more attention. Also, the optimal weights determined in this study can be used to provide a quality management model in luxury residential buildings for future attempts.
- Wasiu A, Aliu A, Modupe A. An Assessment of Implementation of Quality Culture in Construction. 2012.
- Lussier RN, Pfeifer SA. cross national prediction model for business success. Journal of small business management. 2001; 39: 228-239.
- Matias JCDO, Coelho DA. Integrated total quality management: Beyond zero defects theory and towards innovation. Total Quality Management & Business Excellence. 2011; 22: 891-910.
- Philip B. Cost Of Quality in the Construction Industry. Califonia Polytechnic State University, San Luis Obispo. 2009; 17-18
- Arditi D, Gunaydin HM. Factors that affect process quality in the life cycle of building projects. Journal of Construction Engineering and Management. 1998; 124:194-203.
- Mallawaarachchi H, Senaratne S. Importance of quality for construction project success. 6th ICSECM. 2015; 84-89.
- Rumane AR. Quality management in construction projects. Crc Press.
- Mahmoud S. Assessing Contractors Quality Performance in the Nigerian Construction Industry. Unpublished B.Sc. (QS) Theses Ahmadu Bello University, Zaria. 2004.
- Chini AR, Valdez HE. ISO 9000 and the US construction industry. Journal of Management in Engineering. 2003; 19: 69-77.
- Jha K, Iyer K. Critical factors affecting quality performance in construction projects. Total Quality Management and Business Excellence. 2006; 17: 1155-1170.
- Ashworth A, Perera S. Contractual procedures in the construction industry. Routledge, 2018.
- Tengan C. Quality Assurance of sandcrete masonry Blocks and concrete products as practiced on construction sites in Ghana; A case study of the Kumasi Metropolis. BSc Thesis report presented to Building Technology. 2007.
- Solomon O, Obodoh D, Onoh F. Quality Management Practices in Construction; a Key to Successful Building Project Delivery. Imperial Journal of Interdisciplinary Research (IJIR). 2016; 531-538.
- Omran A, Abdalrahman S, Pakir A. Project performance in Sudan construction industry: A case study. Global Journal of Accounting and Economic Reseacrh. 2012.
- Zhao JL, Liu. AD. Empirical study of accounting information quality affecting factors for enterprises’ countermeasures to anti-dumping Hunan Daxue Xuebao. Journal Hunan Univ Nat Sci. 2012; 39: 87–92.
- Zidan A. Factors affecting design quality in construction industry in Syria. Damascus University Journal. 2013; 29: 47-48.
- Neyestani B, Juanzon JBP. Developing an appropriate performance measurement framework for total quality management in construction and other industries. 2016.
- Laiche F, Letaifa AB, Aguili T. QoE Influence Factors (IFs) classification Survey focusing on User Behavior/Engagement metrics. In 2020 IEEE 29th International Conference on Enabling Technologies: Infrastructure for Collaborative Enterprises (WETICE). IEEE. 2020; 143-146.
- Hosseini S, Turhan B. An exploratory study of search based training data selection for cross project defect prediction. 2018 44th Euromicro Conference on Software Engineering and Advanced Applications (SEAA). IEEE; 2018; 244-251.
- Rezaei J. Best-worst multi-criteria decision-making method. Omega. 2015; 53: 49-57.
- Bonyadi Naeini A, Mojaradi B, Zamani M. Prevention of Cardiovascular Diseases by Combining GIS and Fuzzy Best-Worst Decision-Making Algorithm in Areas of Tehran. International Journal of Industrial Engineering & Production Research. 2019; 30: 255-271.
- Rezaei J. Best-worst multi-criteria decision-making method: Some properties and a linear model. Omega. 2016; 64: 126-130.
- Guo S, Zhao H. Fuzzy best-worst multi-criteria decision-making method and its applications. Knowledge-Based Systems. 2017; 121; 23-31.