
More Information
Submitted: May 19, 2022 | Approved: June 30, 2022 | Published: July 01, 2022
How to cite this article: Shahne MZ, Sezavar A, Najibi F. A hybrid deep learning model to forecast air quality data based on COVID-19 outbreak in Mashhad, Iran. Ann Civil Environ Eng. 2022; 6: 019-025.
DOI: 10.29328/journal.acee.1001035
Copyright License: © 2022 Shahne MZ, et al. This is an open access article distributed under the Creative Commons Attribution License, which permits unrestricted use, distribution, and reproduction in any medium, provided the original work is properly cited.
Keywords: LSTM; Air pollution; AQI; COVID-19; Meteorological parameters; Mashhad

A hybrid deep learning model to forecast air quality data based on COVID-19 outbreak in Mashhad, Iran
Maryam Zare Shahne1*, Amir Sezavar2 and Fatemeh Najibi3
1Assistant Professor, K.N. Toosi University of Technology, Tehran, Iran
2Ph.D. candidate, University of Birjand, Birjand, Iran
3Master of science student, K.N. Toosi University of Technology, Tehran, Iran
*Address for Correspondence: Maryam Zare Shahne, Assistant Professor, KN Toosi University of Technology, Tehran, Iran, Email: [email protected]; [email protected]
The SARS-CoV-2 (COVID-19) pandemic outbreak has led to some lockdowns and changed human mobility and lifestyle in this country. Mashhad, one of the most polluted cities in Iran has experienced critical air pollution conditions in recent years. In the present study, the potential relationships between air quality conditions (such as popular index and criteria air pollutant concentration) and COVID-19 cases and deaths were investigated in Mashhad, Iran. To do that, the Long Short-Term Memory (LSTM) based hybrid deep learning architecture was implemented on AQI, meteorological data (such as temperature, sea level pressure, dew points, and wind speed), traffic index and impact number of death, and active cases COVID-19 from March 2019 to March 2022 in Mashhad. The results reveal the LSTM model could predict the AQI accurately. The lower error between the real and predicted AQI, including MSE, MSLE, and MAE is 0.0153, 0.0058, and 0.1043, respectively. Also, the cosine similarity between predicted AQI and real amounts of it is 1. Moreover, in the first peak of the pandemic (Aug 2021), we have the minimum amount of AQI. Meanwhile, by increasing the number of active cases and death and by starting lockdown, because the traffic is decreased, the air quality is good and the amount of AQI related to PM2.5 is 54.68. Furthermore, the decrease the active cases and death in pandemic causes a significant increase in AQI, which is 123.52 in Nov 2021, due to a decline in lockdowns, resumption of human activities, and probable temperature inversions.
The World Health Organization (WHO) revealed that the infectious illness, coronavirus disease (COVID-19) caused by the SARS-CoV-2 virus is a global pandemic in 2019 [1]. This disease appeared firstly in Wuhan, the Republic of China in December 2019, and after that, the first cases were officially confirmed in February 2019 in Qom, Iran [2].
The COVID-19 pandemic has adverse health outcomes, it has led to the loss of human life and shows a significant challenge to public health management worldwide [3,4]. Most people infected with the coronavirus will experience mild or moderate respiratory disease and they will recover without any significant treatment. However, some people, who have certain underlying medical conditions, such as chronic renal failure, heart disease, chronic lung disease (excludes mild or moderate asthma), and non-hematological cancer, will become seriously ill. Also, in the worst cases, this disease will lead to the death of people [5,6]. The statistics reveal that over 7.2 million cases were recorded for this illness, and more than 141000 people died because of the COVID-19 pandemic up to June 2022 in Iran [7].
Besides the physical and mental health outcome, COVID-19 affected the people’s mobility (and also human activity), lifestyle, global economy, social repercussion, and urban development seriously, due to temporary lockdowns (encompassing stay-at-home orders, curfews, quarantines, and similar societal restrictions) [8]. All of these components could be effective (directly or indirectly) on environmental issues. Although scientific projects have been made in the management of this disease; The parameters that affect the disease remain unknown. There are a lot of studies for determining the related environmental factors to the COVID outbreaks [8,9]. Recent studies on the COVID-19 pandemic worldwide have declared a significant correlation between air pollution, climate change, and the COVID-19 outbreak [10].
There are various artificial neural network (ANN) architecture methods including Recurrent Neural Network (RNN), Long Short-Term Memory (LSTM), and Gated Recurrent Unit (GRU) for air pollution monitoring and predicting. All of these tools have a different efficiency on air pollution data in various locations. Meanwhile, deep learning has become increasingly widely used in the fields of artificial intelligence and big data in recent years [11].
Studies show that the LSTM network model is a good way to model some related issues to air pollution data. It is a time-cycle neural network that effectively resolves long-term dependency issues without any gradient disappearance and explosion [20]. Segar V Belavadi proposed a Long Short-Term Memory (LSTM) and Recurrent Neural Network (RNN) to forecast the air pollutant concentrations in Bengaluru city in south India. This analysis shows the performance of the model in two regions that exhibit a significant difference in temporal variations in air quality. Moreover, some studies combined CNN and LSTM-based hybrid deep learning architecture to predict air pollution by using real sensor data and to transfer the model between cities [20,21].
Mashhad is the second biggest religious city in the world and one of the most polluted cities in Iran. Frequent episodes of unhealthy air pollution conditions have been reported in Mashhad, Iran mainly because of accelerated urban population growth and industrial activities and the attraction of more than 14 million pilgrims and tourists each year [14,15]. Mobile sources and power generation sources are the two categories of air pollution sources in Mashhad due to the large population and religious tourist attraction in this region [16].
The main focus of this study is to model AQI variation in COVID-19 by means of LSTM and assess the correlation between AQI and the severity of this illness in Mashhad. This study aimed to evaluate the variations in Air Quality Index (AQI), meteorological parameters, and urban traffic during the COVID-19 outbreak and before that. To do this, daily AQI in all of the calibrate stations was collected in Mashhad for three entire years from March 2019 to March 2022. The data were analyzed by means of the LSTM network model. Major lockdown outcomes in air pollution were identified by using long short-term memory recurrent artificial neural networks. Finally, the AQI has been predicted based on the COVID index, meteorological data, and traffic data. The insights regarding AQI provided by the results of this study could be useful in identifying their health effects and planning effective control strategies.
Study area
This study was conducted in the city of Mashhad (36.2605° N, 59.6168° E), the second-most-populous city in Iran and the capital of Khorasan Razavi Province. It is located in the northeast of the country. This megacity has a population of 3,001,184, known as a place of religious pilgrimage and home to over 20 million pilgrims and tourists per year. Mashhad features a cold semi-arid climate with hot summers and cold winters. As shown in Figure. 1, Mashhad is located within the bounds of the mountain ranges of Binalood and Hezar Masjed, with a mean elevation of 1200 m decreasing from north to south.
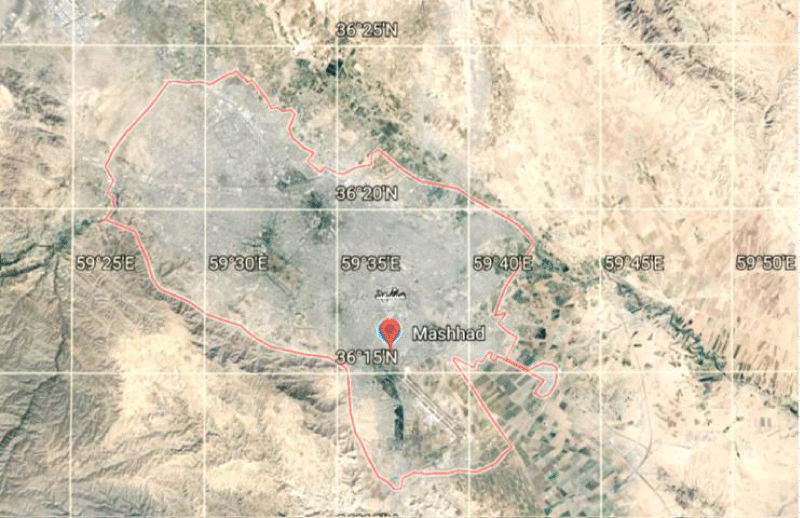
Figure 1: Mashhad megacity as a study area.
In recent years, Mashhad province has experienced unfavorable air pollution conditions. The air quality index is unhealthy on near to one-third of the days and this ratio exceeds 45% on average in the cold phase of 2020-2021 [17]. Furthermore, only two days were in good condition in 2021, and one-two days were very unhealthy and hazardous in some monitoring sites during 2020-2021. It should be noted, that this city contains 23 active and calibrate monitoring stations, they covered entire the city greatly.
Data collection
In general, the primary and meteorological parameters studied in air pollution modeling are wind speed, wind direction, relative humidity, temperature, horizon view, etc. in this study, the implemented weather data are the monthly average of temperature, sea level pressure, dew points, wind speed for synaptic sites in Mashhad province. For these data features, daily average temperature (Co), relative humidity (%), and wind speed (km/h) were extracted from the TuTiempo weather site [18]. Also, daily average Dew Point (oF) and sea level pressure (Hg) were adopted from the Weather Underground website [19]. Therefore, a monthly average of these data was considered meteorological features.
Moreover, the air quality index (AQI), an average number of people who were affected by COVID-19 is studied. In order to extract AQI, first, we found the worst station in each season which had the maximum number of days with the highest AQI, reported in the department of environment in Mashhad [20]. For each station, the maximum AQI related to CO, O3, NO2, SO2, PM10, and PM2.5 is considered as the AQI of the station and for the worst station, and finally, the average AQI is computed for each month.
In order to upgrade the modeling, official daily counts of COVID-19 cases and deaths in Iran reported by Worldometers [21] and the World Health Organization [22] are considered. Based on the reports, the pandemic in Iran has started in February 2020. Four peaks of pandemics have occurred in Iran and also in Mashhad, in Dec 2020, Apr and Aug 2021, and Feb 2022. Some reports from news websites that describe the situation of the coronavirus in Mashhad were used. For example, the report of IMNA [23] denotes that in February 2022, the number of active cases in Mashhad sharply increased and was going into a critical situation. Also, in Aug 2021, the number of death related to COVID-19 was at a high level [24]. To help to model COVID-19 trending in Mashhad, we use also the Spatial-epidemiological dataset [25] which has been collected during the first peak of a pandemic to study the distribution of active cases and death in Mashhad. This dataset includes 4000 patients that were diagnosed between 14 Feb 2020 and 11 May 2020 in Mashhad and denotes characteristics of COVID-19 patients including sex, age, death or recovery, etc. by analyzing this data, we impact a number of death and active cases in Mashhad on our data features.
The last feature of data refers to the traffic index of Mashhad. Because of the direct impact of traffic on air quality and especially PM2.5, it is necessary to study its effect of it. Also, between the pandemic and the lockdown eras, the traffic is expected to decrease and air quality may be affected. So, the traffic index can be considered the main feature to study the effect of the COVID-19 pandemic on air quality. To model the traffic index of Mashhad, we have used the yearly reports of Mashhad Traffic and Transportation Organization. [26], and monthly averages of the number of cars entering and exiting the Mashhad are used as features. These data are presented in Figure 2 and supplementary materials as S1.
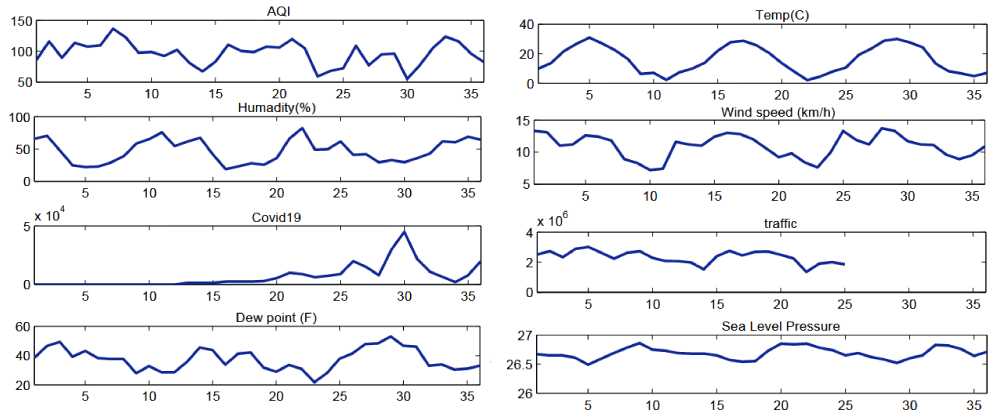
Figure 2: Visualization of features of our data.
Model description
Deep learning is a branch of machine learning that can learn attributes and extract efficient features from big data. Because deep models could achieve brilliant results in machine learning tasks, they are being used in different tasks such as signal and data processing [27]. Among different methods of deep learning Convolutional Neural networks (CNN) [28], Auto encoders, etc., and Recurrent Neural Networks (RNN) [29] are used for time-dependent data processing because using recurrent feedback. LSTM is a kind of recurrent network which has memory blocks in recurrent hidden layers. So, the model can save the parameters of the previous time step to use for the next step. Because we have multiple input variables, multi-variate LSTM is used in this work. An LSTM cell is illustrated in Figure 3.
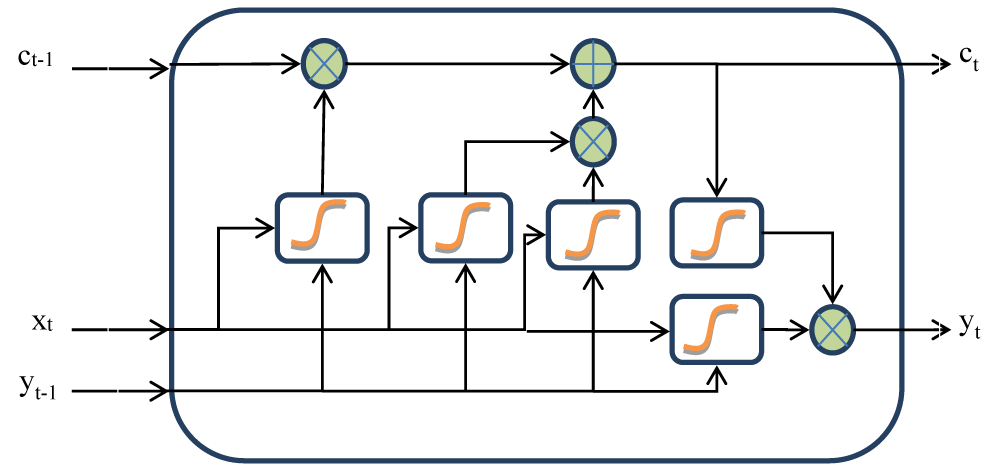
Figure 3: Symbolic illustration of an LSTM cell.
As described in the LSTM paper [29], equations that are used in the cell are summarized as follows:
(1)
(2)
(3)
(4)
(5)
(6)
In the above equations, F denotes the activation function to model nonlinearity, W and Uare weight matrices that will be up to date in each training epoch, xt and yt are the input and output in time instance of t, and refers to the output at the previous instance, t – 1, and C denotes the cell state vector. The model consists of the input layer, hidden LSTM cells, and an output neuron. A number of hidden LSTM cells will be tuned in the training step in order to avoid overfitting.
The data we have collected consists of 8 columns and 36 raws. Each raw describes the average data for one month which starts from March 2019 to February 2022. The considered columns are associated with AQI, meteorological data, impact number of COVID-19, and traffic index in Mashhad.
The first necessary step in this modeling is data pre-processing and normalizing data. We have collected monthly average amounts of temperature, sea level pressure, dew points, wind speed, and AQI. Also, an average number of people who were affected by CCOVID-19 is used and traffic data are modeled. The model uses these data to learn the attribute and predict the future amount of AQI. To this end, we use Log Short Term Memory (LSTM), as a successful model of deep learning approaches.
The model is implemented in python, using machine learning libraries such as Scikit-learn [30], Tensorflow [31], and Keras [32] which are powerful for deep learning approaches. Training and testing approaches were done on a windows system with Core i5 Cpu and 8 GB of Ram.
Model analysis
In this study, data were normalized between 0 and 1 by dividing each column to its maximum. The distributions of normalized data are shown in Figure 4. In order to validate the model, data were categorized into two groups, the training set (80% of data) and the validation set (20% of data). During the training, the model tries to learn and model the attributed parameters in air quality data. the training and validation states of the model are presented in Figure 5 in which, Loss function, Mean Squared Error (MSE), Mean Squared Logarithmic Error (MSLE), and Mean Absolute Error (MAE) for the training and validation set are shown.
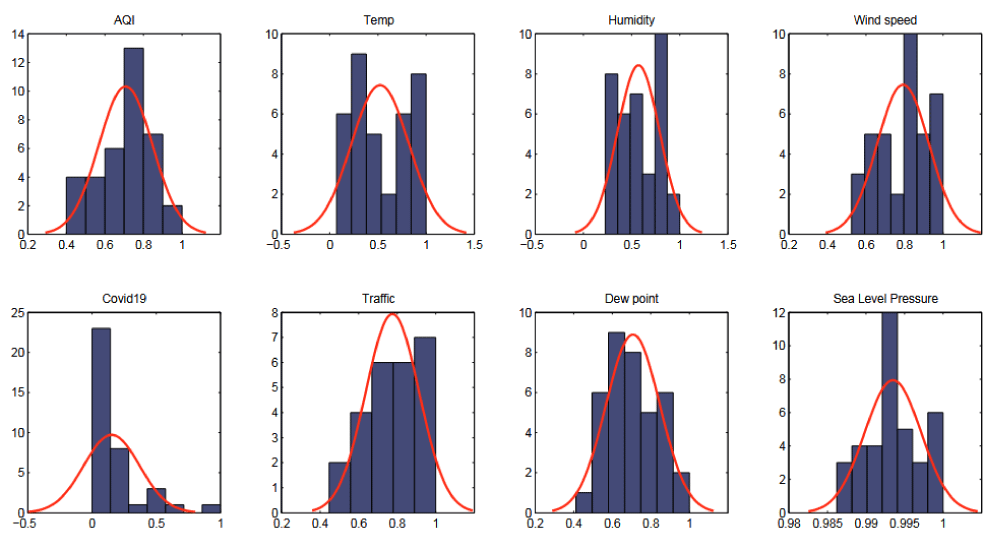
Figure 4: Distribution of normalized data for the city of Mashhad from March 2019 to March 2022.
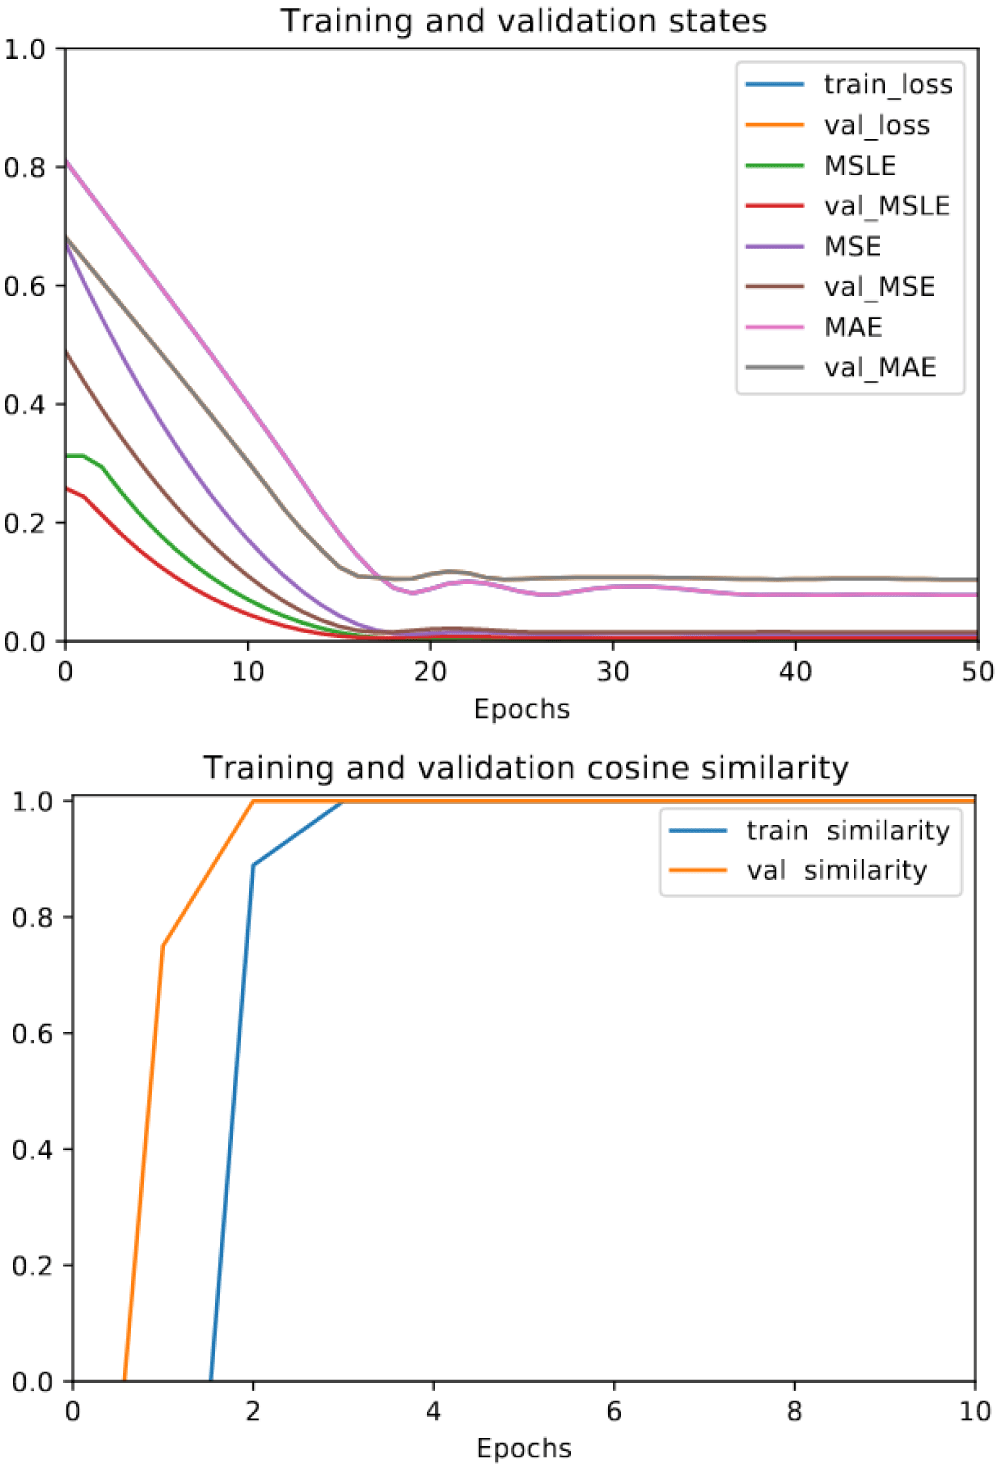
Figure 5: Training states and Metrics of errors in different epochs.
It can be understood from the training state diagram, that the model is trained well and without overfitting. As for both training and validation set model converged to a flat area near zero, the method can be used generally for new data to predict air quality with low error. After 50 epochs of the training model, the training loss function (which is going to be minimum) decreases to 0.0783, and validation loss for new data decreases to 0.1043. three different metrics are used to demonstrate the effectiveness of model prediction. The lower error between the real and predicted AQI means the better prediction and MSE, MSLE, and MAE for validation data are 0.0153, 0.0058, and 0.1043, respectively. Also, the cosine similarity between predicted AQI and real amounts of it is 1, therefore, it can be concluded the model can predict the AQI accurately.
In order to best present the results of the simulation, the average predicted amounts of AQI between 08/2020 and 03/2021 (which have been considered as validation era and have not been used for the training model) and the real amounts are shown in Figure 6.
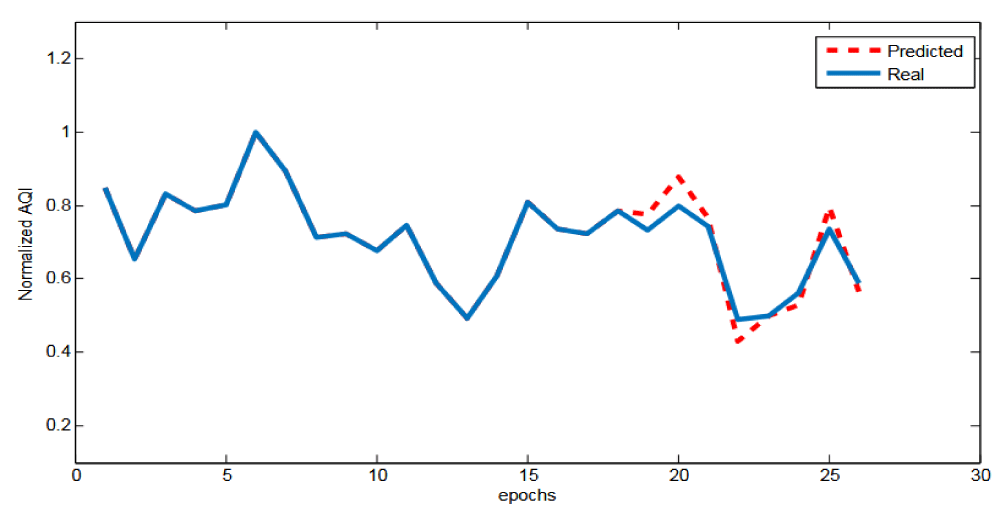
Figure 6: Real and predicted AQI.
Based on Figure 4, we can result that the model could predict the new AQI by using weather information, traffic index, and COVID-19 trends. The red dashed line demonstrate the predicted amounts of AQI, while the blue line indicates the real amount. We can see that the predicted line could follow the real line accurately.
As a discussion on the effect of COVID-19 on air quality in Mashhad, the normalized features of COVID-19 and AQI are plotted in Figure 7. In the first peek of the pandemic (Aug 2021), we have the minimum amount of AQI. meanwhile, by increasing the number of active cases and death and by starting lockdown, because the traffic is decreased, the air quality is good and the amount of AQI related to PM2.5 is 54.68. Furthermore, by following the trend in Figure 6, it can be seen that decreasing the active cases and death in pandemic causes a huge increase in AQI, which is 123.52 in Nov 2021 (Figure 7).
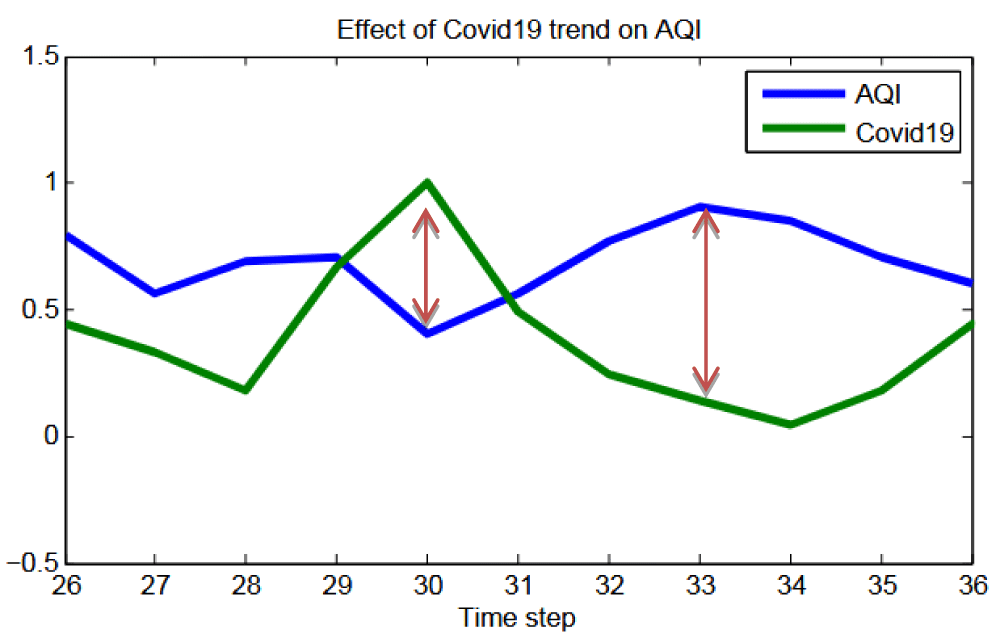
Figure 7: Plotting normalized COVID-19 trend and AQI in order to distinguish the effect of a pandemic on air quality.
Sensitivity analysis
In order to compare the sensitiveness of the model regarding different parameters, different error metrics are computed with different parameters and are listed in Table 1.
| Table 1: Error metrics of simulation regarding to different train setup. | ||||
| Type of model | Loss | MAE | MSE | MSLE |
| LSTM block=10 (Batch Size=16) |
0.0993 | 0.1291 | 0.0193 | 0.0071 |
| LSTM block=20 (Batch Size=16) |
0.0801 | 0.1054 | 0.0144 | 0.0054 |
| LSTM block=25 (Batch Size=16) |
0.0774 | 0.1046 | 0.0156 | 0.0060 |
| LSTM block=30 (Batch Size=16) |
0.0802 | 0.1098 | 0.0177 | 0.0068 |
| Batch Size=4 (LSTM block=25) |
0.0762 | 0.1087 | 0.0145 | 0.0054 |
| Batch Size=8 (LSTM block=25) |
0.0809 | 0.1229 | 0.0235 | 0.0090 |
| Batch Size=32 (LSTM block=25) |
0.0816 | 0.1295 | 0.0247 | 0.0094 |
It can be seen from Table 1 that the best results of MSE and MLSE are achieved when the number of LSTM blocks is equal to 20 with a batch size of 16. By increasing the number of LSTM blocks to more than 25, the complexity of the model will increases, so an increase in metrics can be understood. Also, a batch size of 16 can be appropriate for training the model. Based on the results, we can see that the model is reliable for predicting the air quality in the city of Mashhad.
In this study, the air quality index in the COVID-19 pandemic was examined. The results of this study are consistent with some other studies. We observed that social lockdown has drastic effects on the air pollution situation. Moreover, there is a negative correlation between the severity in COVID-19 patients and AQI in Mashhad [33]. It shows that the lockdowns reduced the emissions of AQI and also criteria air pollutants in Mashhad, Iran [34,35].
The outbreak of SARS-CoV-2 has led to the COVID-19 pandemic in March 2020 and caused over 4.5 million deaths worldwide by September 2021. Besides the public health crisis, COVID-19 affected the global economy and development significantly. In the present study, the AQI was modeled by meteorological parameters, traffic index, and impact number of COVID by Long Short Term Memory Network. It is an advanced RNN, a sequential network, that allows information to persist. It is capable of handling the vanishing gradient problem faced by RNN. The results reveal that LSTM could capable to predict AQI, accurately, due to sensitivity and error analysis parameters. Moreover, the AQI was associated with the COVID index inversely, due to temporary lockdowns and decreasing traffic in the pick of this disease in Mashhad.
- WHO. 2019. [Accessed https://www.who.int/emergencies/diseases/novel-coronavirus-2019]
- Blandenier E, Habibi Z, Kousi T, Sestito P, Flahault A, Rozanova L. Initial COVID-19 Outbreak: An Epidemiological and Socioeconomic Case Review of Iran. Int J Environ Res Public Health. 2020 Dec 21;17(24):9593. doi: 10.3390/ijerph17249593. PMID: 33371485; PMCID: PMC7767487.
- Douglas M, Katikireddi SV, Taulbut M, McKee M, McCartney G. Mitigating the wider health effects of covid-19 pandemic response. BMJ. 2020 Apr 27;369:m1557. doi: 10.1136/bmj.m1557. PMID: 32341002; PMCID: PMC7184317.
- Gold JA. Covid-19: adverse mental health outcomes for healthcare workers. BMJ. 2020 May 5;369:m1815. doi: 10.1136/bmj.m1815. PMID: 32371465.
- Bambra C, Riordan R, Ford J, Matthews F. The COVID-19 pandemic and health inequalities. J Epidemiol Community Health. 2020 Nov;74(11):964-968. doi: 10.1136/jech-2020-214401. Epub 2020 Jun 13. PMID: 32535550; PMCID: PMC7298201.
- WORLD HEALTH O. Clinical management of severe acute respiratory infection when novel coronavirus (2019-nCoV) infection is suspected: interim guidance, 28 January 2020. Geneva: World Health Organization.
- WORLDOMETERS. 2022. [Accessed https://www.worldometers.info/coronavirus/country/iran/].
- LEKIĆ GLAVAN O, NIKOLIĆ N, FOLIĆ B, VITOŠEVIĆ B, MITROVIĆ A, KOSANOVIĆ S.. COVID-19 and City Space: Impact and Perspectives. Sustainability, 2022; 14.
- Cheval S, Mihai Adamescu C, Georgiadis T, Herrnegger M, Piticar A, Legates DR. Observed and Potential Impacts of the COVID-19 Pandemic on the Environment. Int J Environ Res Public Health. 2020 Jun 10;17(11):4140. doi: 10.3390/ijerph17114140. PMID: 32532012; PMCID: PMC7311982.
- Marazziti D, Cianconi P, Mucci F, Foresi L, Chiarantini I, Della Vecchia A. Climate change, environment pollution, COVID-19 pandemic and mental health. Sci Total Environ. 2021 Jun 15;773:145182. doi: 10.1016/j.scitotenv.2021.145182. Epub 2021 Jan 21. PMID: 33940721; PMCID: PMC7825818.
- Chau PN, Zalakeviciute R, Thomas I, Rybarczyk Y. Deep Learning Approach for Assessing Air Quality During COVID-19 Lockdown in Quito. Front Big Data. 2022 Apr 4;5:842455. doi: 10.3389/fdata.2022.842455. PMID: 35445191; PMCID: PMC9014303.
- CHANG Y-S, CHIAO H-T, ABIMANNAN S, HUANG Y-P, TSAI Y-TC, LIN K-M. An LSTM-based aggregated model for air pollution forecasting. Atmospheric Pollution Research, 2020; 11, 1451-1463.
- ZENG Y, CHEN J, JIN N, JIN X, DU Y. Air quality forecasting with hybrid LSTM and extended stationary wavelet transform. Building and Environment, 108822. 2022.
- KETABI D, ESMAILI R, ALIDADI H, PEIROVI R, JOULAEI F. Evaluation of Mashhad City Air Quality based on Air Quality Index (AQI), 2015. Journal of Research in Environmental Health, 2016; 2, 228-236.
- SOLTANIFARD H, JAFARI E. A conceptual framework to assess ecological quality of urban green space: a case study in Mashhad city, Iran. Environment, Development and Sustainability, 2019; 21.
- SHAHBAZI H, ABOLMAALI AM, ALIZADEH H, SALAVATI H, ZOKAEI H, ZANDAVI R, TORBATIAN S, YAZGI D, HOSSEINI V. Development of high-resolution emission inventory to study the relative contribution of a local power plant to criteria air pollutants and Greenhouse gases. Urban Climate, 2021; 38, 100897.
- Miri M, Derakhshan Z, Allahabadi A, Ahmadi E, Oliveri Conti G, Ferrante M, Aval HE. Mortality and morbidity due to exposure to outdoor air pollution in Mashhad metropolis, Iran. The AirQ model approach. Environ Res. 2016 Nov;151:451-457. doi: 10.1016/j.envres.2016.07.039. Epub 2016 Aug 24. PMID: 27565880.
- PITCHFORD A, PITCHFORD M, MALM W, FLOCCHINI RG, CAHILL T, WALTHER E. Regional analysis of factors affecting visual air quality. Atmospheric Environment (1967), 1981; 15, 2043–2054.
- DAHER N, RUPRECHT A, INVERNIZZI G, DE MARCO C, MILLER-SCHULZE J, HEO J, SHAFER M, SHELTON RB, SCHAUER J, SIOUTAS C. Characterization, sources and redox activity of fine and coarse particulate matter in Milan, Italy. Atmospheric Environment, 2012; 49, 130–141.
- KOTIANOVA P, PUXBAUM H, BAUER H, CASEIRO A, MARR I, CIK G. Temporal patterns of n-alkanes at traffic exposed and suburban sites in Vienna. Atmospheric Environment - ATMOS ENVIRON, 2008; 42, 2993-3005.
- PULLES T, DENIER VAN DER GON H, APPELMAN W, VERHEUL M. Emission factors for heavy metals from diesel and petrol used in European vehicles. Atmospheric Environment, 2012; 61, 641–651.
- LAWRENCE S, SOKHI R, KHAIWAL R, MAO H, PRAIN HD, BULL I. Source apportionment of traffic emissions of particulate matter using tunnel measurements. Atmospheric Environment, 2013; 77, 548–557.
- PERRONE M, CARBONE C, FAEDO D, FERRERO L, MAGGIONI A, SANGIORGI G, BOLZACCHINI E. Exhaust emissions of polycyclic aromatic hydrocarbons, n-alkanes and phenols from vehicles coming within different European classes. Atmospheric Environment, 2014; 82, 391-400.
- MAGLIANO K, HUGHES V, CHINKIN RL, COE D, HASTE LT, KUMAR N, LURMANN F. Spatial and temporal variations in PM 10 and PM 2.5 source contributions and comparison to emissions during the 1995 integrated monitoring study. Atmospheric Environment, 1999; 33, 4757-4773.
- MohammadEbrahimi S, Mohammadi A, Bergquist R, Akbarian M, Arian M, Pishgar E, Kiani B. A spatial-epidemiological dataset of subjects infected by SARS-CoV-2 during the first wave of the pandemic in Mashhad, second-most populous city in Iran. BMC Res Notes. 2021 Jul 27;14(1):292. doi: 10.1186/s13104-021-05710-9. PMID: 34315517; PMCID: PMC8313880.
- SHI G-L. A Comparison of Multiple Combined Models for Source Apportionment, Including the PCA/MLR-CMB, Unmix-CMB and PMF-CMB Models. Aerosol and Air Quality Research. 2014.
- GUO Y, LIU Y, OERLEMANS A, LAO S, WU S, LEW MS. Deep learning for visual understanding: A review. Neurocomputing, 2016; 187, 27-48.
- KRIZHEVSKY A, SUTSKEVER I, HINTON GE. Imagenet classification with deep convolutional neural networks. Advances in neural information processing systems, 2012. 1097-1105.
- SHERSTINSKY A. Fundamentals of recurrent neural network (RNN) and long short-term memory (LSTM) network. Physica D: Nonlinear Phenomena, 2020; 404, 132306.
- MANOUSAKAS M-I, DIAPOULI E, PAPAEFTHYMIOU H, MIGLIORI A, KARYDAS A, PADILLA ALVAREZ R, BOGOVAC M, KAISER R, JAKSIC M, RADOVIC I, ELEFTHERIADIS K. Source apportionment by PMF on elemental concentrations obtained by PIXE analysis of PM10 samples collected at the vicinity of lignite power plants and mines in Megalopolis, Greece. Nuclear Instruments and Methods in Physics Research Section B: Beam Interactions with Materials and Atoms, 2015; 349.
- HTTPS://WWW.TENSORFLOW.ORG/.
- KAMALI N, ZARE SHAHNE M, ARHAMI M. Implementing Spectral Decomposition of Time Series Data in Artificial Neural Networks to Predict Air Pollutant Concentrations. Environmental Engineering Science, 2015; 32, 379-388.
- Mousazadeh M, Paital B, Naghdali Z, Mortezania Z, Hashemi M, Karamati Niaragh E, Aghababaei M, Ghorbankhani M, Lichtfouse E, Sillanpää M, Hashim KS, Emamjomeh MM. Positive environmental effects of the coronavirus 2020 episode: a review. Environ Dev Sustain. 2021;23(9):12738-12760. doi: 10.1007/s10668-021-01240-3. Epub 2021 Feb 4. PMID: 33558801; PMCID: PMC7859094.
- Paital B, Das K, Parida SK. Inter nation social lockdown versus medical care against COVID-19, a mild environmental insight with special reference to India. Sci Total Environ. 2020 Aug 1;728:138914. doi: 10.1016/j.scitotenv.2020.138914. Epub 2020 Apr 23. PMID: 32339832; PMCID: PMC7179495.
- Paital B, Agrawal PK. Air pollution by NO2 and PM2.5 explains COVID-19 infection severity by overexpression of angiotensin-converting enzyme 2 in respiratory cells: a review. Environ Chem Lett. 2021;19(1):25-42. doi: 10.1007/s10311-020-01091-w. Epub 2020 Sep 18. PMID: 32982622; PMCID: PMC7499935.