
More Information
Submitted: May 14, 2022 | Approved: May 23, 2022 | Published: May 24, 2022
How to cite this article: Tchanang G, Djangang CN, Abi CF, Moukouri DLM, Djabo GTN, et al. Nano-silica from kaolinitic clay used as adsorbent for anionic and cationic dyes removal: linear and non-linear regression isotherms and kinetics studies. Ann Civil Environ Eng. 2022; 6: 008-018.
DOI: 10.29328/journal.acee.1001034
Copyright License: © 2022 Tchanang G, et al. This is an open access article distributed under the Creative Commons Attribution License, which permits unrestricted use, distribution, and reproduction in any medium, provided the original work is properly cited.
Keywords: Nano-silica; Adsorption; Dyes; Isotherms/kinetic models; linear/nonlinear regression

Nano-silica from kaolinitic clay used as adsorbent for anionic and cationic dyes removal: linear and non-linear regression isotherms and kinetics studies
Gustave Tchanang1, Chantale Njiomou Djangang1*, Charles Fon Abi2, Danie Laure Mbella Moukouri1, Guillonnel Trésor Nyadjou Djabo1, Jean Marie Kepdieu1 and Philippe Blanchart3
1Department of Inorganic Chemistry, University of Yaounde I, POB 812, Cameroon
2Department of Chemistry, High Teachers Training College of Yaounde, University of Yaoundé I, POB 47, Cameroon
3University of Limoges, Institute of Research for Ceramics – IRCER, 12 rue Atlantis 87068 Limoges, France
*Address for Correspondence: Chantale Njiomou Djangang, University of Yaoundé I, Department of Inorganic Chemistry, University of Yaounde I., POB 812, Cameroon, Email: [email protected]
The increasing occurrence of wastewaters associated with industrial development has begotten a permanent search for new and more efficient techniques for the removal of hazardous substances such as heavy metals and dyes. The use of natural and available resources to develop improved and sustainable commodities for this purpose remains crucial and is among promising emerging green technologies for water treatment. It offers the gradual shifting of hazardous industrial chemicals precursors to the abundant non-metallic mineral resources that receive an added value. This work investigated the uptake capacity by the adsorption process of methylene blue (MB) and azocarmine G (AG) onto nano-silica synthesized from kaolinite clay. The effects of contact time (0-30 min), the adsorbent dosage (5-100 mg), the initial pH of the solution (1-11 for MB and 1-7 for AG), and the initial dye concentration (5-50 mg/L) were studied. The selected conditions to carry out kinetic and isotherm adsorption experiments were: 15 mins, 20 mg, 11 for MB, 1.01 for AG, and 50 mg/L. Four adsorption isotherms and three kinetic models were used to model the adsorption data thanks to linear and non-linear regression methods. From the obtained results, the Freundlich isotherm model fitted well the adsorption phenomenon while the pseudo-second-order kinetic model described well the adsorption mechanism. Furthermore, the free energy of adsorption was similar for the two absorbents, 0.71 kJ, pointing physisorption as the dominant adsorption mechanism. The optimum MB and AG uptake were respectively 13.8 and 36.1 mg/g. Conclusively, the nano-silica represents a potentially viable and powerful adsorbent whose use could lead to a plausible improvement in environmental preservation.
The treatment of wastewater remains one of the greatest focuses for environmental remediation. It is an increasing preoccupation as far as concerns the whole living organism’s health is concerned, from humans to fauna through the flora. Moreover, the tendency of wastewater quantity discharged in nature is contingent on the evolution of the technology’s development. More and more industries use water and chemicals which are turned into liquid waste mixtures at the end of the manufacturing process. Dyes are some one of the most abundant pollutants and hazardous substances found in these wastes since they are recurrently among raw materials for several products such as plastic, leather, textile, paper, and paint manufactures to cite only that [1,2]. These dyes are mostly organic compounds containing functional groups from which their toxicity is pertaining [1,3,4]. For instance, methylene blue, is known as an azote specie and a cationic dye while azocamine G, is an anionic compound with many functional groups such as phenyl, acid, sulfonate, etc. The toxicity of these dyes has been demonstrated in the literature that it has diverse damaging effects on humans: severe headache, chest pain, breathing difficulty, skin and eye irritation, etc. In addition, the original and induced color of dyes disrupts direct sunlight with a negative impact on living organisms jeopardizing the photosynthesis process or the waves to be absorbed through our skins. Furthermore, these dyes are difficult to be directly biodegraded and photodegraded [4.5].
As long as technological development has led to the use of chemicals that are found in nature, as a result, are a real concern for our communities as well as their use. Effective methods have also been developed to face up to the adverse effects on living beings in particular. We can mention trapping and degradation techniques, including electrochemical, oxidation, and adsorption with their improved methods [6-8,11-15]. These methods always present limits related to the total destruction of waste due to their difficult degradation and the management of residues. Moreover, we can also mention the difficult access to them since their use requires mostly advanced techniques which are costly and not affordable by all. Scientific research endeavors are being increasingly dedicated to the development of techniques for water treatment that ensure low-cost monitoring techniques with less or no environmental impact.
The use of natural and available resources for sustainable development has improved. And this is without fail one of the most investigated routes that led to putting in place a reasonable effective cost and friendly environmental methods. In this sense, Advanced Oxidation Processes (AOPs) have recently emerged and can be comparable to adsorption, The latter remains, however, the most used method because it displays many advantages like reasonable effective cost, simplicity and flexibility, easy to use, and to control; the only challenge is the choice of the right adsorbent to use [7-11]. The use of many types of natural adsorbents for the removal of methylene blue (MB) and azocarmine G (AG) is reported in the literature. For instance, natural clay, sludge, montmorillonite, flax fiber, zeolite, biochar, rice husk, pinewood, wheat, sugarcane bagasse, switchgrass, Ficus carica bast [5,16-27].
Above all, the use of nanomaterials through the adsorption has been demonstrated to be cheap and has high efficiency in the removal and destruction of common pollutants presented in nature, irrespective of their type and origin [28-30]. In this process, nanomaterials are entitled nano absorbents, [31] their crucial role pertains to their peculiar small size that begets properties such as a large specific surface area, fast dissolution, and high reactivity. Literature investigations have however shown that nanomaterials are mostly synthesized from industrial chemicals with a risk to induce hazardous effects on living organisms [32]. That is why the use of natural and available resources as precursors in the synthesis of nanomaterials endow the benefit of the promising emerging green technology [33,34]. But for the good of our knowledge, nano-silica is among the novel adsorbents that have ncaught little or no attention in the literature. This work aims to study the isotherms and kinetics adsorption behavior of methylene blue (MB) and azocarmine G (AG) from an aqueous solution using nano-silica.
Adsorbent
The adsorbent used in this study is nano-silica with characteristics shown in Table 1, it is obtained from local kaolinite clay via the bottom-up sol-gel technic described in our previous work [35]. Its pH at zero-point charge (pHzpc) was measured following the method reported in the literature [36-38]. For this purpose, eleven (11) reference solutions of 1 mol/L NaCl, 99.5%) with an initial pH between 2 and 12 were prepared and their pH precisely determined. For each of these solutions, 0.1 g of adsorbent was added to 50 mL. After contact time of 72 hours under stirring at room temperature, the suspension was centrifuged (Eppendorf brand centrifuge, type 5840R at 3000 rpm for 5 min) and the final pH of the filtrate was measured. The pH was plotted against the initial pH; the pHZPC corresponds to the pH for which the curve cuts the x-axis. All pH measurements were done with a digital pH meter, type CT-6023.
Adsorbates
Two adsorbates, Methylene blue (C16H18N3SCl.3H2O, 98.5%) and azocarmine G (C28H18N3S2O6Na; 100%) were obtained from the Fisher market and used without further purification. The solutions were prepared by dissolving the required amount of dyes in distilled water. Figure 1 shows the chemical structures of methylene blue (319.85 g/mol) and azocarmine G (579.43 g/mol).
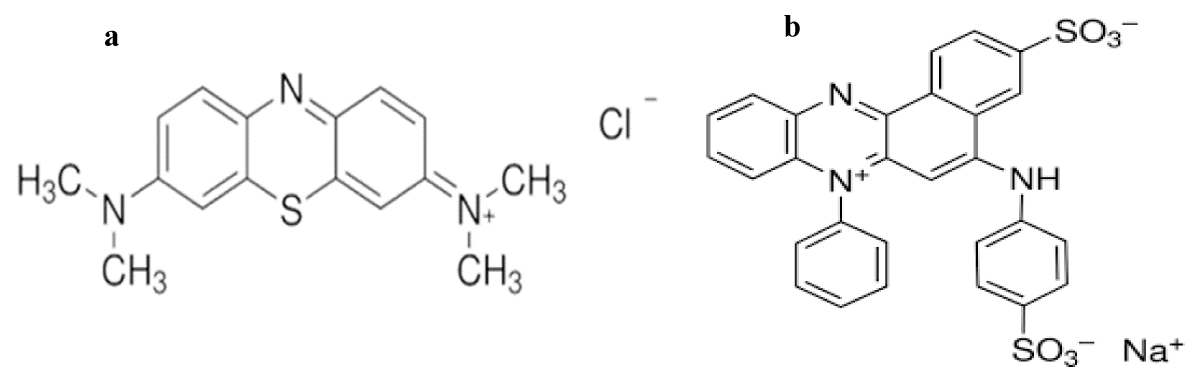
Figure 1: Chemical structure of Methylene Blue (a), azocarmine G (b).
| Table 1: Characteristics of adsorbent nano-silica. | |
| Parameters | Value |
| Specific surface area (m2/g) | 81.03 |
| Particle size (nm) | 23 ± 4 |
| Structure of particle | Amorphous structure |
| Shape of particle | Spherical shape/ Homogeneous morphology |
From the molecular formula, C16H18N3SCl, also called methylthionine chloride, its dissolution in aqueous solution yields a cation active adsorbate compound, Eqs 1:
(1)
Similarly, azocarmine G, with the molecular formula, C28H18N3O6S2Na begets an anionic active adsorbate compound, Eqs 2:
(2)
Adsorption experiments
Firstly, for each absorbate (MB and AG), 1L of 50 mg. L-1 solution was prepared by dissolving the appropriate mass, 50.77 mg for MB and 50 mg for AG in distilled water. From thence, batches of aliquot solutions, 5-30 mg.L-1 of 250 mL each were prepared by dilution. Secondly, adsorption experiments were performed by adding 20 mg of adsorbent into 20 mL of adsorbate solutions respectively, blending under stirring for the required contact time before filtrating, and analyzing the filtrates using UV Vis spectrophotometry (Spectro Direct AQUALYTIC), at 669 nm for BM and 500 nm for AG. Different processing parameters including initial pH, contact time, adsorbent dosage, and initial dye concentration in solution were considered. The percentage of dye removal, quantity adsorbed at equilibrium and at any given time interval was calculated following Eqs 3, 4, 5:
(3)
(4)
(5)
With qe: the adsorption capacity of the adsorbent, C0, Ce, and Ct are respectively the initial, equilibrium and at time t concentration (mg/L) of an adsorbate in solution, V: the volume of dye solution (L), mB: the mass of adsorbent used, and qt quantity adsorbed at a given time interval.
Kinetic and adsorption isotherm models
Isotherm models: For this study, four models of the isotherm were used, Langmuir, Freundlich, Temkin, and Dubinin-Kaganer-Radushkevich (D-K-R).
Langmuir model
The linear and non-linear equations of the Langmuir model are represented by Eqs 6 and 7:
(6)
(7)
With: Qe is the quantity of adsorbate fixed at equilibrium, qm is the maximum adsorbed quantity, Ce is the concentration at equilibrium and KL is the Langmuir constant depending on the nature of the solution, the temperature, and the adsorbent surface.
By plotting Ce/Qe vs. Ce, the values of Qm and KL were calculated from the slope and the y-intercept of the straight line obtained.
Freundlich model
The non-linear equation of the Freundlich model is represented by the Eqs 8:
(8)
With KF a positive empirical parameter related to the adsorption capacity and 1/n the heterogeneity factor.
The linear transform of the Freundlich isotherm by taking the logarithm of the 2 members of the Eqs 9 gives:
ln (9)
By plotting ln qe vs. ln Ce, the values of n and KF were calculated from the slope and the ordinate of the straight line was obtained.
Temkin model
A linear and non-linear model of Temkin isotherm can be described by the following Eqs 10, 11:
qe = B ln(KT) + B lnCe (10)
(11)
Where KT and B are the constants of Temkin isotherm.
By plotting qe vs. lnCe, the value of B was determined from the slope and the ordinate of the straight line obtained.
Dubinin-Kaganer-Radushkevich (D-K-R)
A linear and non-linear model of Dubinin-Kaganer-Radushkevich (D-K-R) is represented by the Eqs 12 a and b:
ln qe= ln qs- Bε² (12a)
(12b)
where qs is the D-K-R constant and ε can be correlated as Eqs 13:
(13)
where R is the gas constant (8.314 J/mol K) and T is the absolute temperature (K).
By plotting ln qe vs. ε² the value of B (activity coefficient) was determined from the slope and qs (Sorption capacity mg/g) from the intercept of the straight line obtained.
The free energy E (kJ/mol) of sorption can be was calculated from the following formula 14:
(14)
When the value of energy found was in the range of 8–16 kJ mol−1, the adsorption was chemical.
Kinetic models: To describe the mechanism of the adsorption process of MB and AG by nano-silica, three kinetic models of pseudo-first-order, pseudo-second-order, and Elovich were used to test the experimental data and their linear [36] and non-linear forms are respectively given by the Eqs 15-120.
Pseudo-order model 1 or Lagergren model:
(15)
qt = qe [1- Exp (-k1t)] (16)
Where qe and qt are the concentration of MB dye adsorbed at the equilibrium and at a time (t) respectively, and k1 is the rate constant of adsorption.
Pseudo-order model 2
As for the pseudo-second-order model, the following equation was fitted to the experimental data:
(17)
(18)
Elovich model
The Elovich model as also used and is expressed by Eqs 16, 17:
(19)
The simplified form of the Elovich model is as follows:
(20)
Where qt is the concentration of the solute adsorbed at time t; α, the speed constant (mg/g/min); β, the adsorption constant (mg/g) during any experiment; t, the adsorption time. By plotting q vs. ln (t), a straight line was obtained whose slope and y-intercept led to the determination of β and α, respectively.
Validity of the isotherm and the kinetic models
The correlation coefficient (R2), root mean square error (RMSE), and Chi-square test (χ2) which are given by the Eqs 21, 22, and 23-26: [39] were used to evaluate the validity of different aforementioned models.
(21)
(22)
(23)
(24)
(25)
(26)
Where, qe.exp and qe.pre are experimental and predicted equilibrium adsorption capacities.
The best fitting and similarity of a model with experimental data is decided by the largest value of R2 (or smallest values of RMSE and χ2).
The largest value of R2 (or smallest values of RMSE and χ2) permits to decision on the best fitting and similarity of a model with experimental data.
pH of adsorbent at a zero-point charge (pHZPC)
From Figure 2, the pHzpc of the adsorbent, nano-silica is 8.01. It is well known that pH is an influencing parameter that generally alters the surface charge of the adsorbent as well as the dissociation of the solute. It can then be assumed that in a strongly acidic environment, much lower than the pHZPC, the oxygenated sites on the surface of the adsorbent are hydrogenated and carry a positive charge. While in a weakly acidic environment, the adsorbent dissociates to form neutral sites following the hydrogenated sites. At pHZPC, the surface of the adsorbent is neutral. In a basic medium, at pH ≥ pHZPC, there is the dissociation of the hydroxylated surface functions of the adsorbent and the appearance of negatively charged sites at the surface of the adsorbent. By Kifuani, et al. [40], these explanations can be translated by chemical Eqs 27 – 29:
at pH ≤ pHZPC: (27)
at pH = PhZPC : (29)
This implies that below the pH = 8.01, the surface charge of the nano-silica used as adsorbent is positive, there would be repulsion between cationic compound adsorbate, C16H18N3S+, and attraction between anionic compound adsorbate, C28H18N3O6S2-. Whereas above this pH, the surface charge of the absorbent is negative and obviously the interactions between adsorbates and adsorbents will be reversed. Considering that, repulsion does not favor the adsorption capacity, the suitable pH for MB adsorption is ≥ 8.01 and for AG adsorption is ≤ 8.01. This is in accordance with previous works in which the determination of the pH of adsorbent at zero-point charge permitted choosing the alkalinity/acidity of the adsorption milieu [41-43].
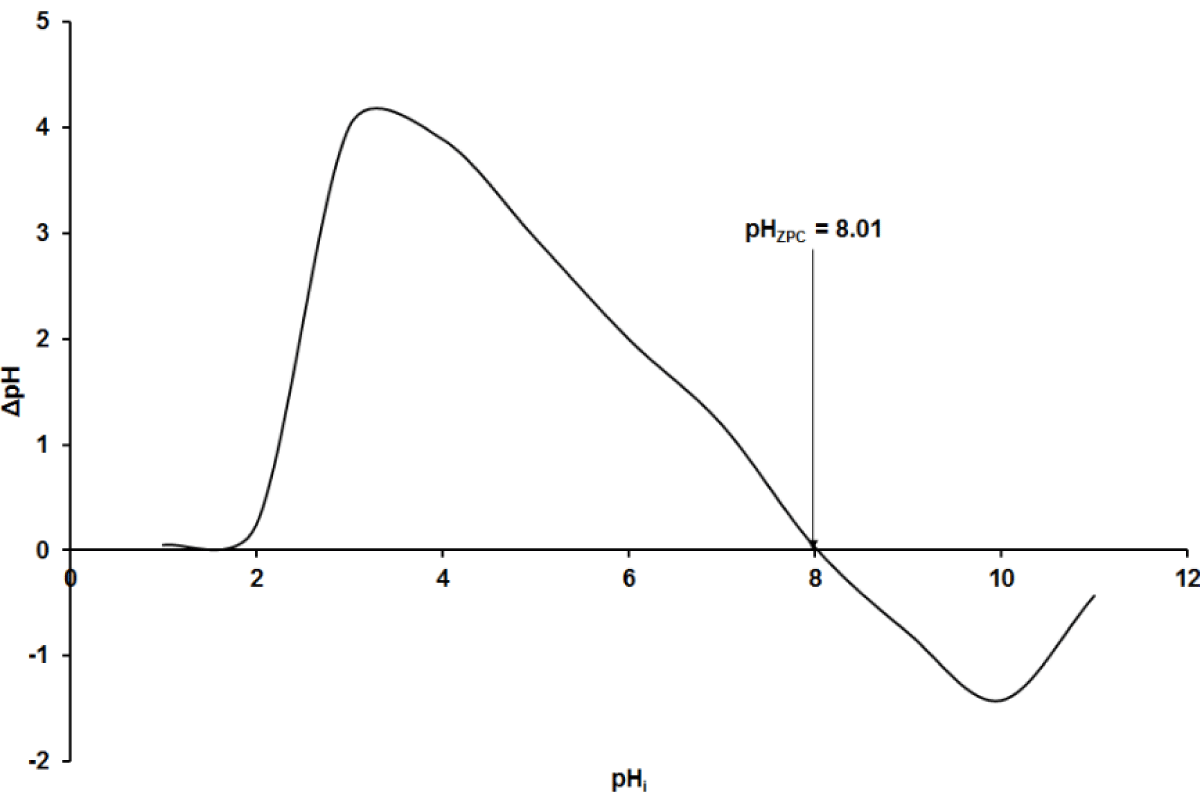
Figure 2: pH at a zero-point charge.
Influence of processing parameters on the removal of dyes
>The effect of some processing parameters on the adsorption kinetics was studied including the effect of contact time, initial dye concentration, adsorbent dosage, and pH of the dye solution.
Effect of pH: Figure 3A showed an increase in the adsorption capacity of the adsorbent with the pH of MB adsorbate solution. The rate of increase is low in an acidic range compared to the basic side. However, in accordance with the explanation given about the pH of the adsorbent at a zero-point charge, poor adsorption was expected with MB in an acidic milieu due to the electrostatic repulsion between the cationic adsorbate and the positive surface sites of the adsorbent. The occurrence of adsorption can then be accountable for the possible dative bond between heteroatoms (N and S) of MB and the adsorbent. In a basic medium, the electrostatic attraction between the negative surface of the adsorbent and the cationic adsorbate species, C16H18N3S+ is obvious with correspondingly high values of the adsorption capacity. The other contributions can be attractive π-π and π-n between positive silica surface and the aromatic nuclei of methylene blue.
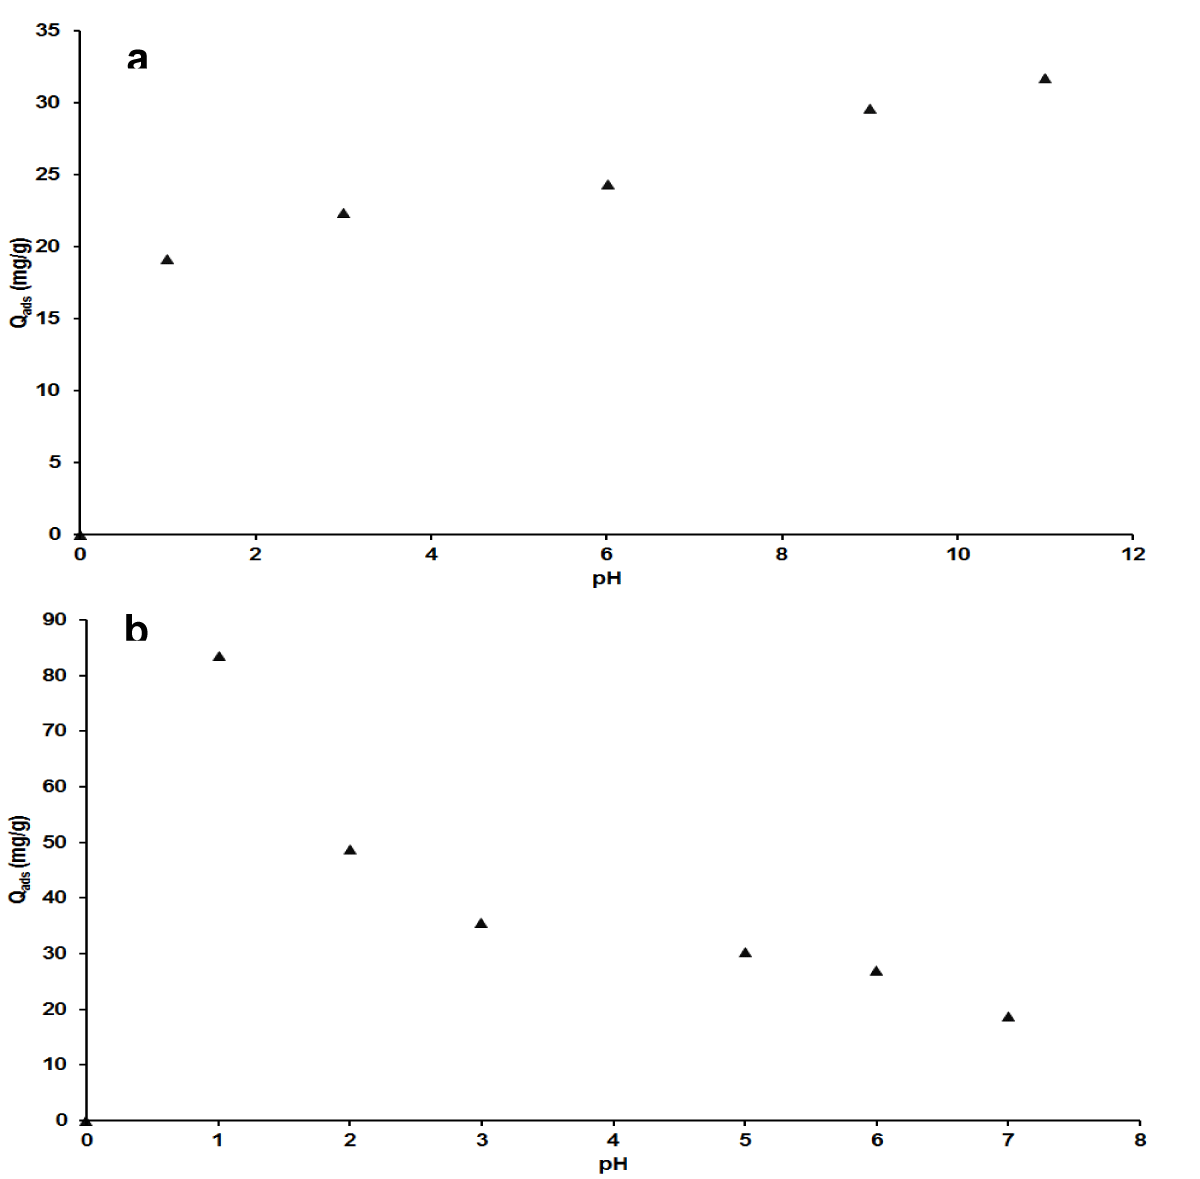
Figure 3: Effect of pH on adsorption capacity for MB (a), AG (b).
Electrostatic interactions have been an effective interpretation of the effect of pH in adsorption, used by numerous authors. The case of the adsorption of methylene blue was largely investigated. For instance, Gnana, et al. [44]; Madhavakrishman, et al. [45] obtained an optimum pH of 8 and 10 for the adsorption of MB on the bio adsorbent based on the leaves of Syzygium cumini L. and on a bio adsorbent derived from the agricultural waste of Cucumeropsis mannii Naudin respectively. In this work, the value of the pH equal to 11 was taken as the optimum pH for the adsorption of methylene blue to the nano-silica adsorbent. In the case of AG, Figure 3b exhibited a decrease in adsorption capacity with the rise of pH. From the maximum value at pH = 1.01, the rate of decrease is significant up to pH = 3 in comparison to the values of pH range to 7 where the adsorption capacity has decreased to more than a quarter of the initial feature. The adsorption comportment of azocarmine G is in respect to the prediction done with pHZPC interpretation that indicates the occurrence of adsorption in an acidic medium. Thus, it can be concluded that the adsorption of azocarmine G is best in a strongly acidic medium (pH = 1). This is because when pH is higher than the isoelectric point, the charge on the surface of the adsorbent is negative, which is not favorable for electrostatic interactions with anionic species adsorbate, C28H18N3O6S2-. At pH equal to the isoelectric point, the surface of the adsorbent is neutral, and when below the isoelectric point the surface of the adsorbent is positive and then favorable for electrostatic attraction, thus for high adsorption [41,42,46].
Effect of contact time: Figure 4a-b exhibits speedy adsorption between 5 and 10 first minutes that is followed by a slight decrease in the range of 10-15 minutes and a steady behavior up to 30 minutes of contact time of adsorbent/adsorbate, for both adsorbates used. There is a slight decrease noticed between 10-15 minutes can be ascribed to the internal fixation of adsorbate species since they have just been instantaneously accumulated at the adsorbent surface up to the saturation of sites from the first contact. A similar interpretation made by Madhavakrishman, et al. indicated with precision that the mentioned fixation is at the level of microspores with a surely lower rate of adsorption [38]. It can furthermore point out that the equilibrium is speedily established within 15 minutes of contact adsorbent/adsorbates, with adsorbed quantity equals to 13.807 mg/g for MB and 36.087 mg/g for AG.
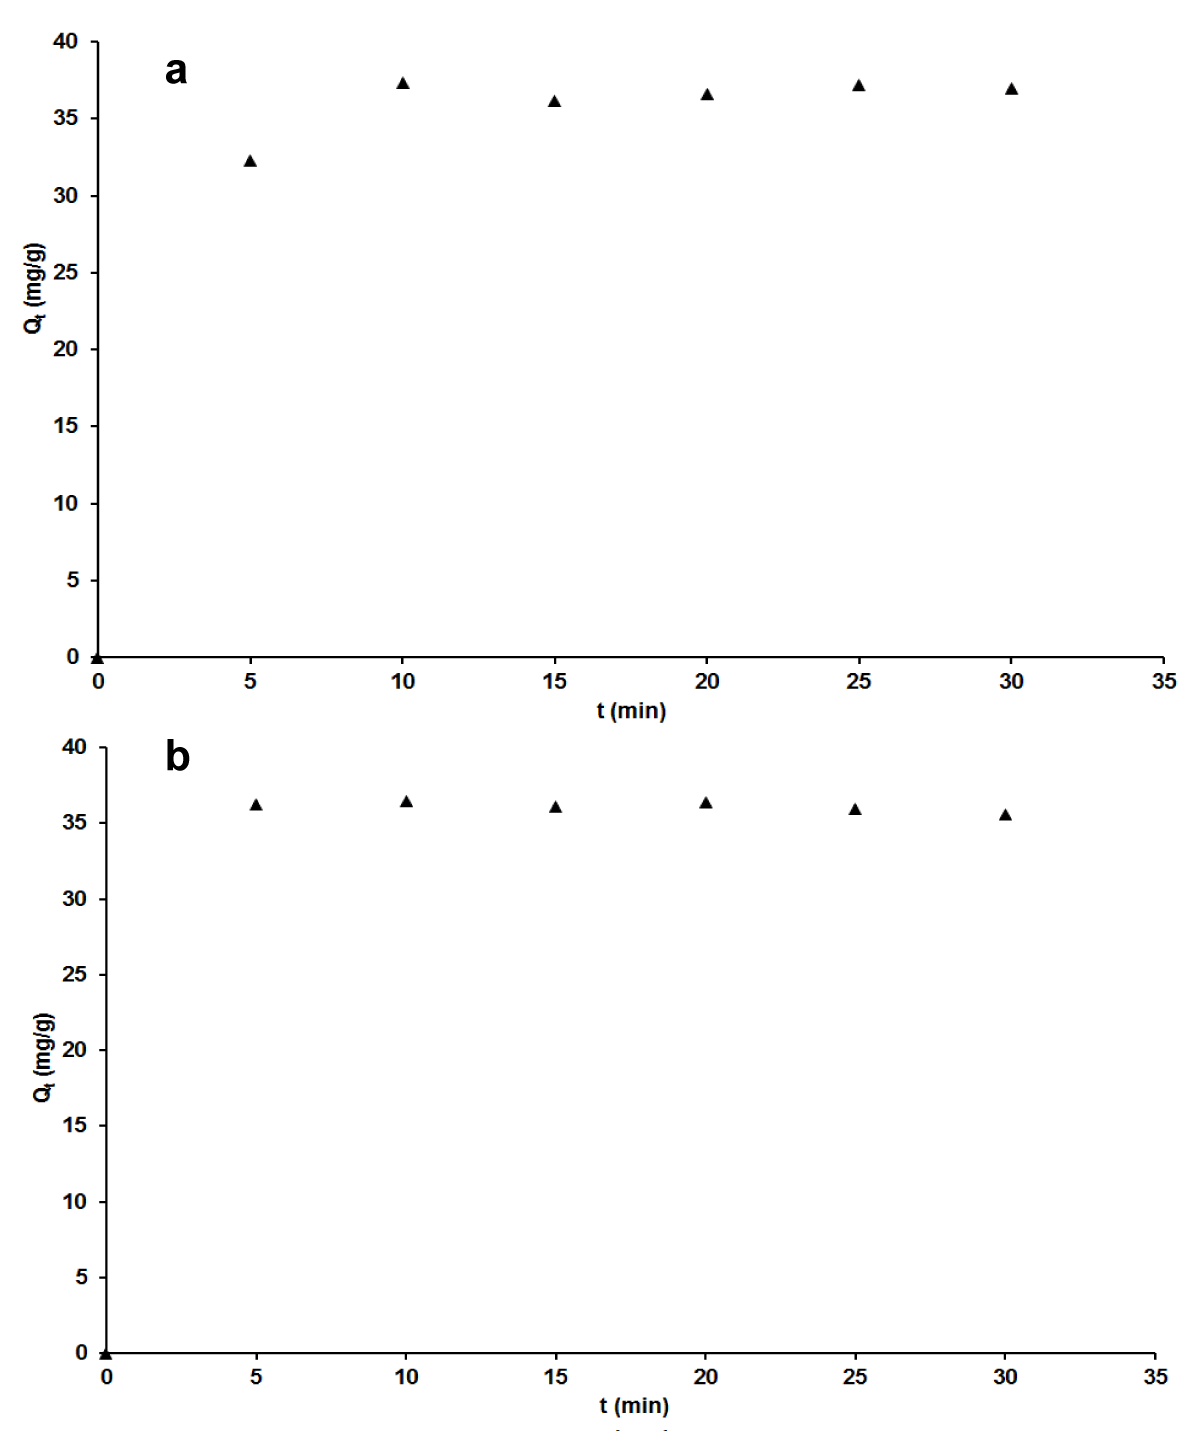
Figure 4: Effect of contact time on adsorption capacity for MB (a) and AG (b).
Effect of adsorbent dosage: For both adsorbates MB and AG, Figure 5 a,b showed a decrease in adsorption capacity with the rise of nano-silica adsorbent mass. The rate of decrease is more noticeable in low quantities and becomes progressive as the mass of the adsorbent is high. This observation indicated 20 mg as the maximum mass of nano-silica for optimum adsorption. The better understanding is the free specific surface area at the lower mass of adsorbent that begets the availability of sites and then promotes adsorption, against the conjunction at higher quantity with subsequent low adsorption. To be totally in agreement with some authors who got the same tendency in the investigation of the effect of adsorbent dosage, the higher mass lengthens the distance between adjacent T sites [47,48].
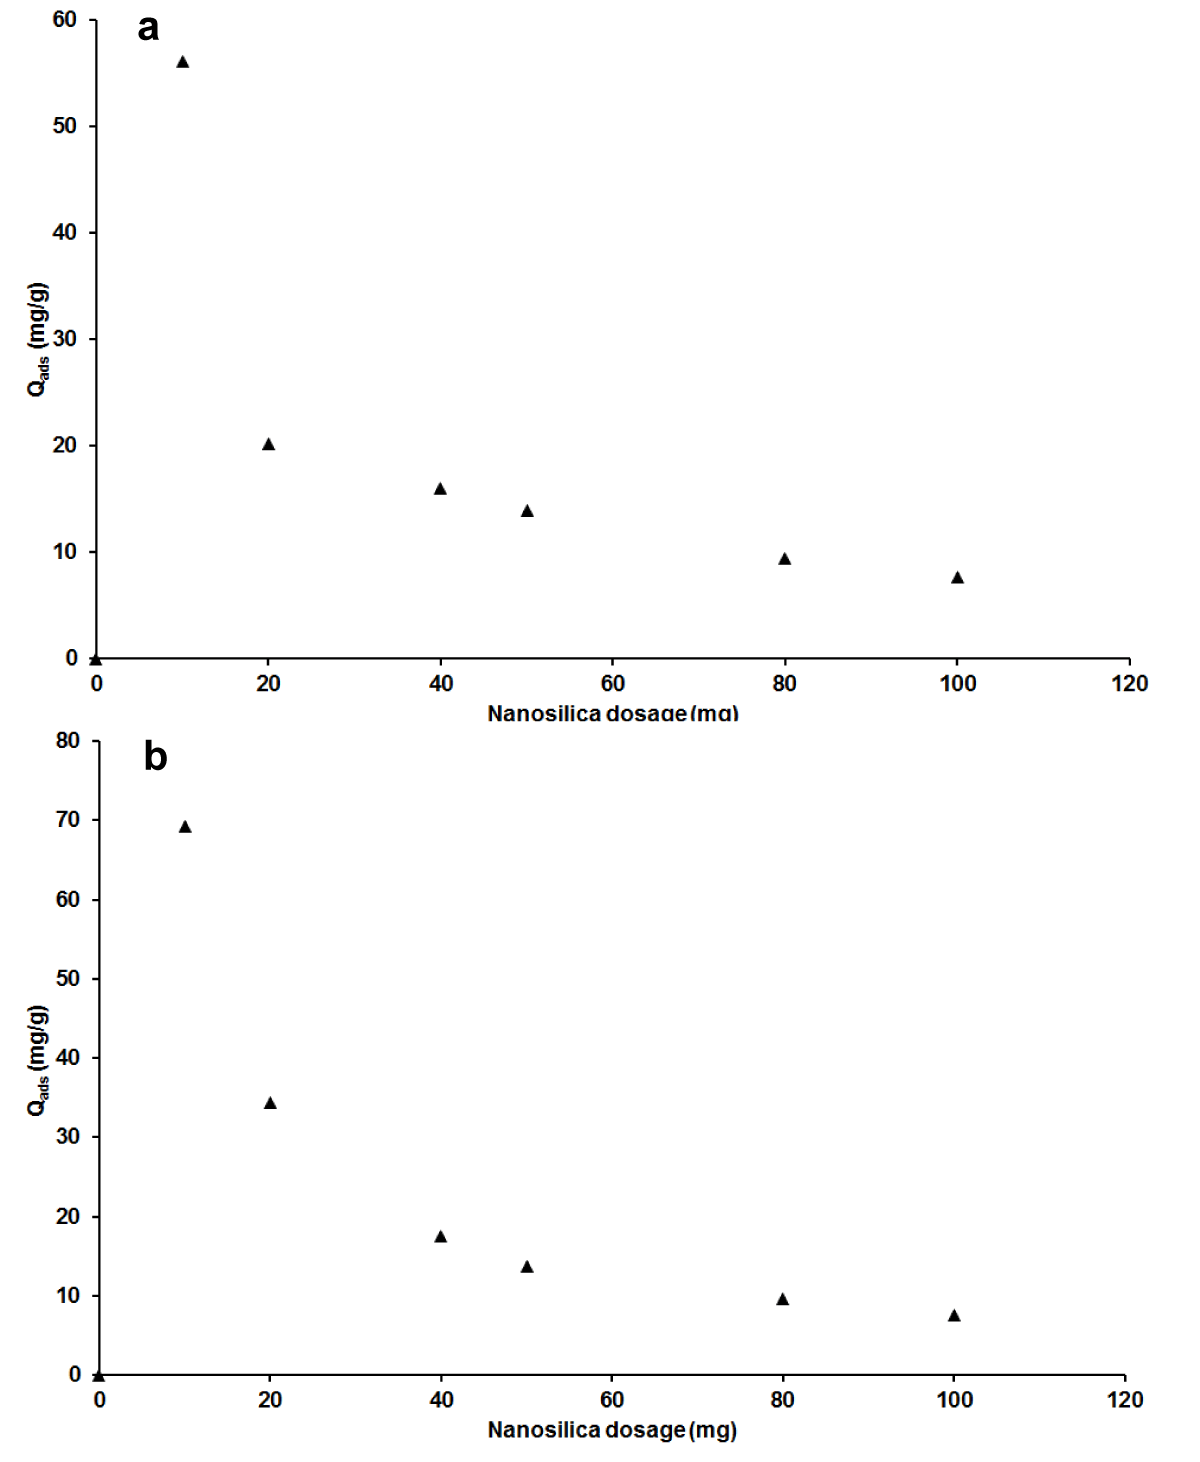
Figure 5: Effect of adsorbent mass on adsorption capacity for MB (a), AG (b).
Effect of initial concentration of adsorbates
Figure 6 a,b exhibits the adsorption capacity as a function of the initial concentration of each of the two pollutants. The results showed that the adsorbed quantity of adsorbates per unit mass of adsorbent increased with the initial concentration of adsorbates, MB and AG. This indicates that at each considered concentration of dyes, there are enough available sites for adsorption. This also describes the higher adsorption capacity of the nano-silica adsorbent and its efficiency even for a high concentration of pollutants. This is a remarkable advantageous behavior of this adsorbent because most cases found in the literature reported contrastive observation where the adsorption capacity is inversely proportional to the initial concentration of the pollutants [1,48].
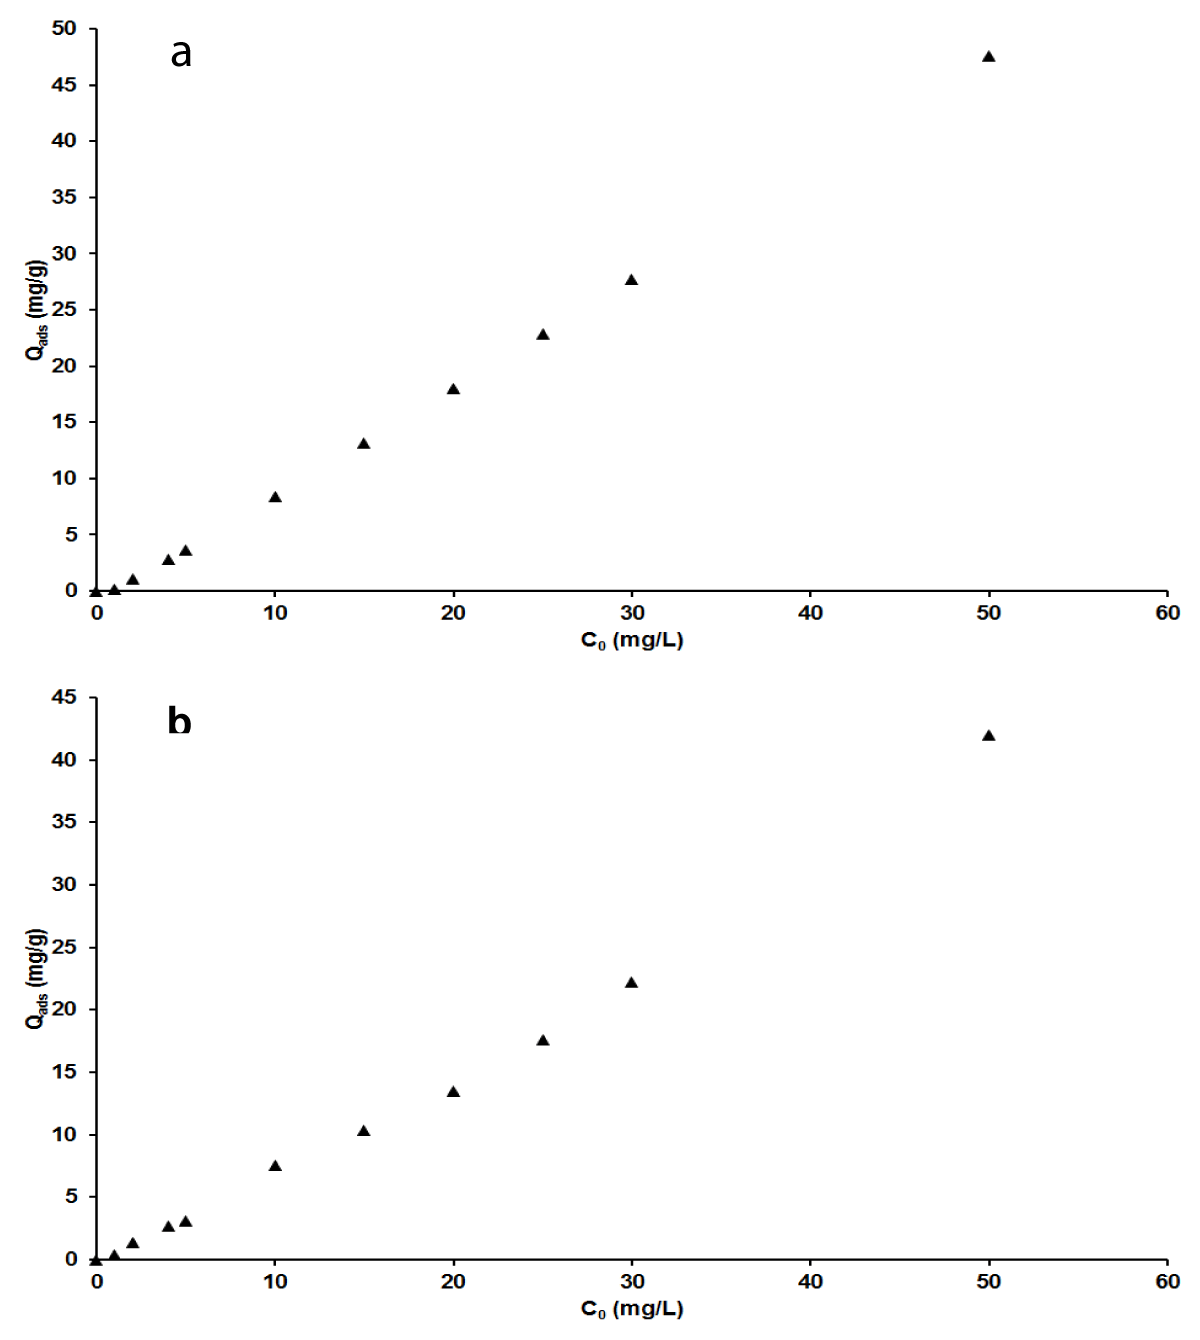
Figure 6: Effect of initial concentration on adsorption capacity for MB(a), AG (b).
Adsorption Isotherms
The plots of non-linear and linear the four adsorption isotherms of Langmuir, Freundlich, Temkin, and Dubinin-Kaganer-Radushkevich (D-K-R) were presented in Figure 7a-e for MB and Figure 8 a-e for AG respectively and the values of their calculated parameters are reported in Table 2. These were very important to study the equilibrium parameters and adsorption properties and also to better understand the nature of the interactions between the adsorbent and the adsorbate. They provide information on the optimal use of adsorbents. Correspondingly, these results displayed that the Freundlich isotherms are good suitability for the adsorption of MB and AG because of their highest R2 value (smallest χ2 value). A dimensionless constant separation factor (RL) was calculated according to Eqs 30 [49-51], to determine whether the adsorption process is favorable.
(30)
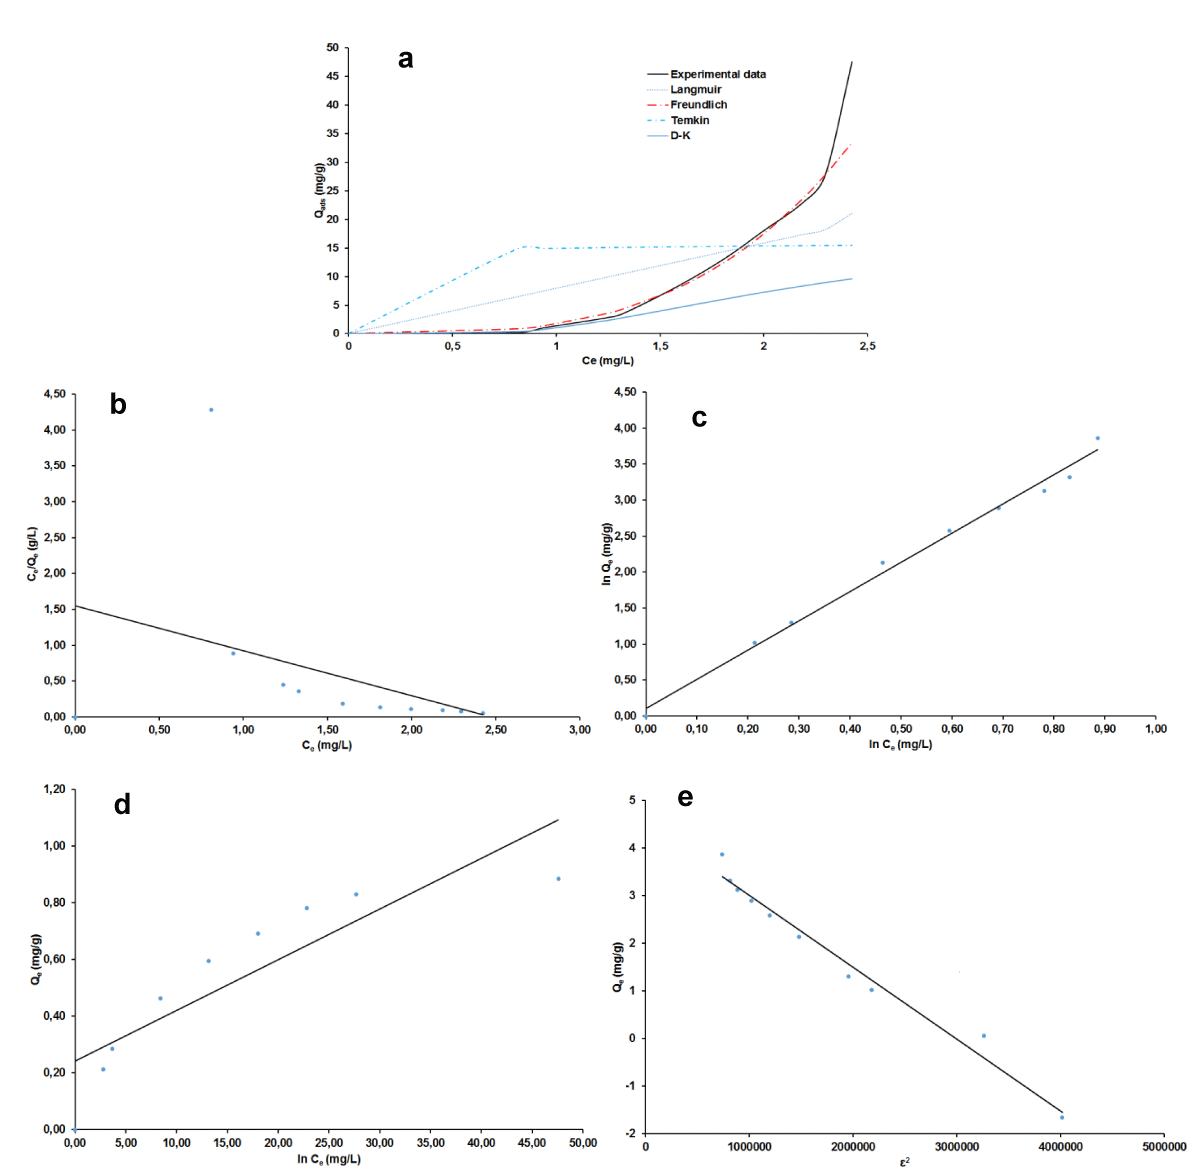
Figure 7: Adsorption isotherm plots for BM: non-linear (a), linear Langmuir (b), Freundlich (c), Temkin (d), D-K-R (e).
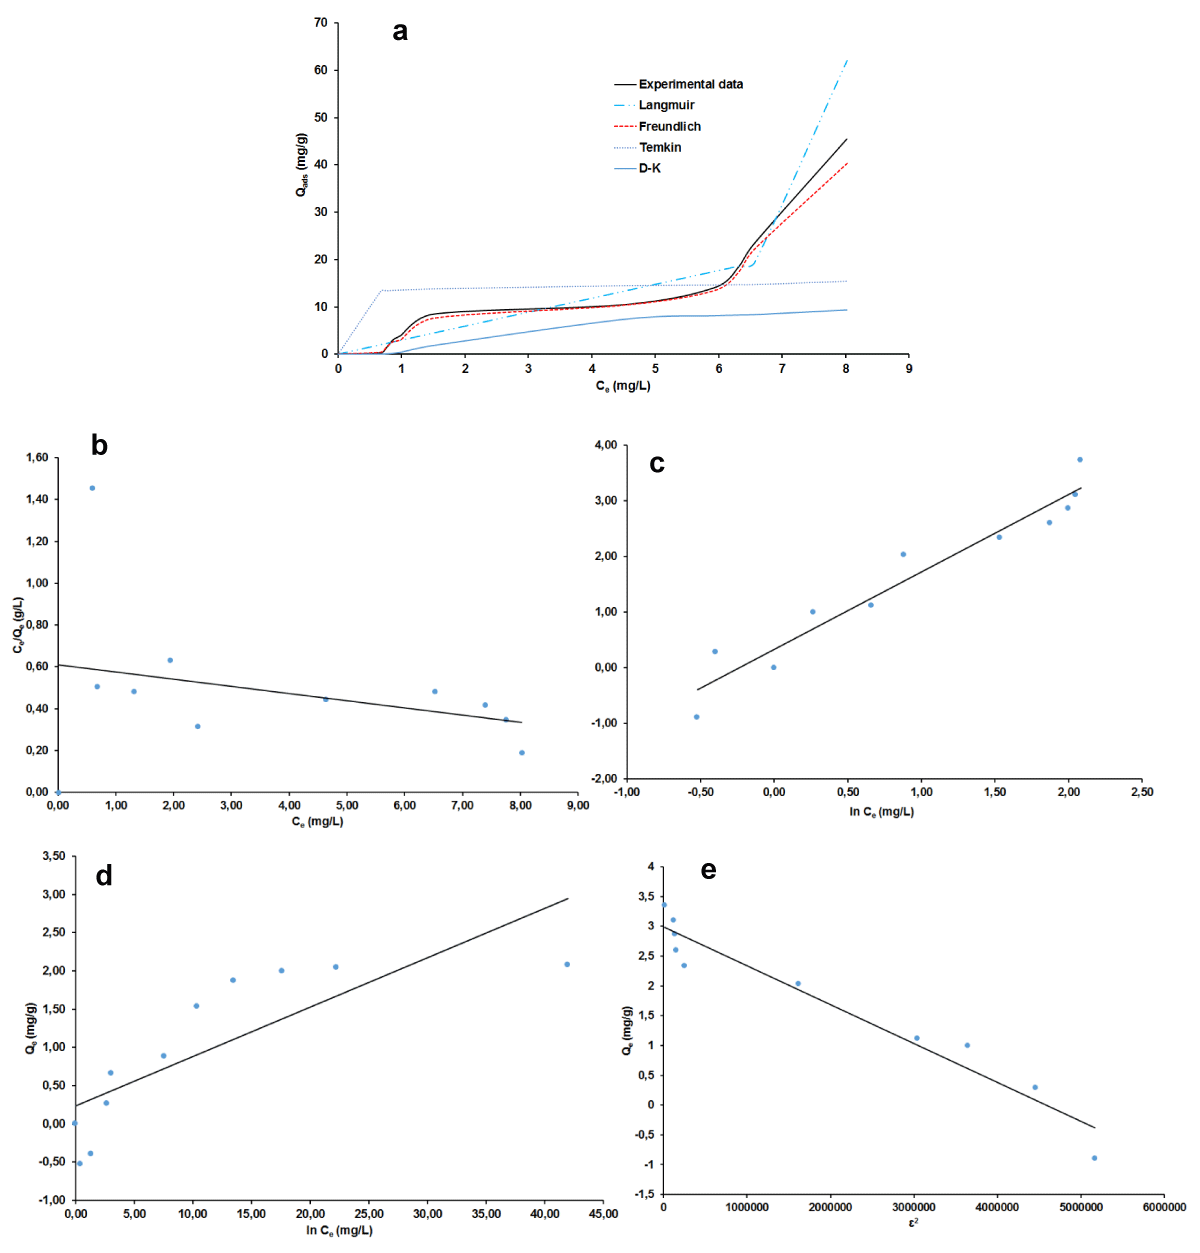
Figure 8: Adsorption isotherm plots for AG: non-linear (a), linear Langmuir (b), Freundlich (c), Temkin (d), D-K-R (e).
| Table 2: Non-linear isotherms parameters for MB and AG adsorption on nano-silica. | |||
| Isotherms Models | Isotherms parameters | ||
| Langmuir | BM | AC | |
| qm (mg.g-1) | 7580.600 | 41.29 | |
| KL (L.mg-1) | 0.001 | 0.115 | |
| RL | 0.947 | 0.148 | |
| R2 | 0.953 | 0.742 | |
| RMSE | 2.503 | 0.754 | |
| χ2 | 25.200 | 4.672 | |
| Freundlich | KF (mg.g-1) | 1.688 | 4.979 |
| 0.867 | 0.595 | ||
| R2 | 0.996 | 0.938 | |
| RMSE | 0.384 | 1.057 | |
| χ2 | 0.852 | 6.850 | |
| Temkin | KT (L.mg-1) | 4.66 x 10¹⁰ | 4.66 x 10⁹ |
| B | 4089.136 | 4089.13 | |
| R2 | 0.953 | 0.677 | |
| RMSE | 1.247 | 2.312 | |
| χ2 | 49.265 | 40.462 | |
| D-K-R | qs (mg.g-1) | 20.2 | 9.5 |
| B (mol2.kJ-2.10-4) | 10.00 | 10.06 | |
| E (KJ.mol-1) | 0.707 | 0.707 | |
| R2 | 0.74 | 0.73 | |
| RMSE | 1.88 | 1.12 | |
| χ2 | 38.08 | 53.32 | |
The value of RL was found to be equal to 0.950 and 0.934 respectively for MB and AG indicating that the type of isotherm is favorable [52-55]. The Freundlich model has favorable characteristics for MB and AG since the n value is between 1 and 10 for both materials and also the high value of KF.
The free energy E of adsorption obtained from the Dubinin–Radushkevich isotherm model, gave almost similar values of 0.71 kJ for the two adsorbates. This value militates in the favor of physical adsorption mechanism since it is lesser than 8 kJ/mol [47,54-55]. The occurrence of this mechanism is more likely as it is in good agreement with the process parameters which pertain to its definition [56]. That is the experimental temperature which was around ambient, 27 °C, then less than the boiling point of the two adsorbates dyes and the low heat of adsorption. The reversibility of the fixation of the dye onto the nano-silica adsorbent and the low chemical bonds between compounds in contact is beneficial for the regeneration and reuse of the adsorbent. However, as physical adsorption is known to be more related to absorbate, the prospect of an experimental regeneration investigation of the adsorbent nano-silica is still very important to further its adsorption characterization.
Adsorption kinetics
The curves of non-linear and linear of the three adsorptions kinetic pseudo-order 1; pseudo-order 2 and Elovich are shown in Figure 9 a-d for MB and Figure 10 a-d for AG while the kinetic parameters are summarized in Table 3. It can be deduced that for the pseudo-second-order, values of RMSE and χ2 are the lowest while that of R2 is the highest, which suggests that this kinetic model fits well to correlate kinetic data of both MB and of AG. Moreover, the calculation of adsorbed quantities of dyes using this model conceded values very close to the experimental ones: 38.43 against 37.41 mg/g for MB and 14.08 - 14.00 mg/g for AG. In agreement with Tabi, et al. [43] this closer of the theoretical and the experimental values suggests a possible competition in the adsorption process between physisorption and chemisorption for the two dyes. Further consideration of the Elovich model brought out the fact that the initial constant rate (A) is greater than the desorption coefficient (B) revealing the probable chemisorption mechanism. This observation, which is not in perfect accordance with adsorption data isotherm modeling discussed above suggests not only the adsorbent regeneration study as already mentioned but also the determination of thermodynamic parameters as far as the real application of the adsorbent is concerned. In fact, when it comes to being a chemical adsorption mechanism, both adsorbent and adsorbate properties are involved.
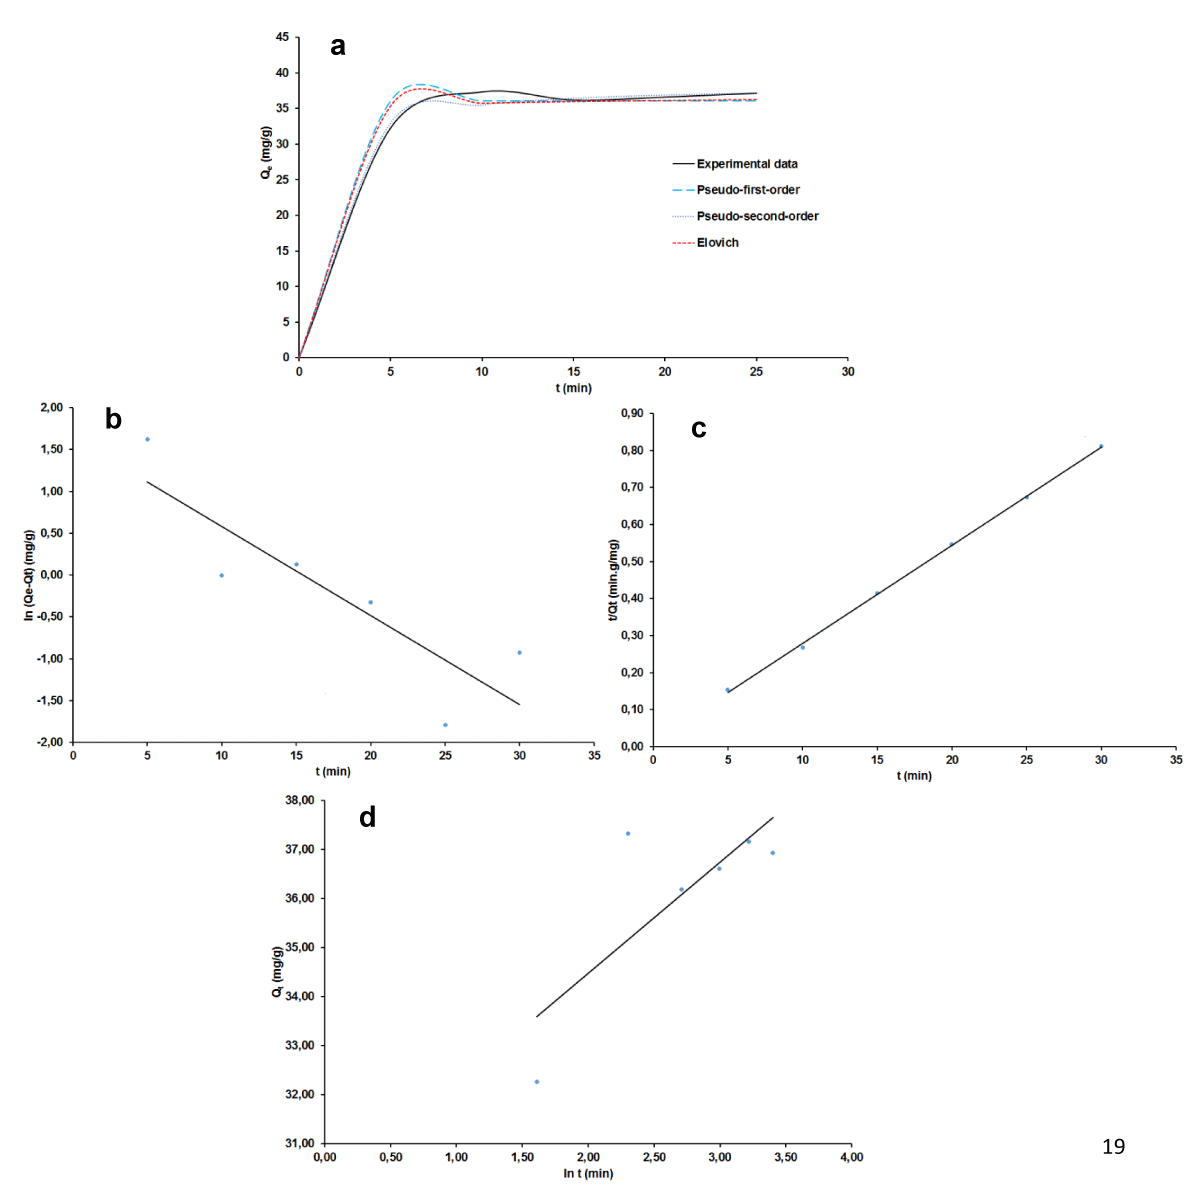
Figure 9: Adsorption kinetics plots for BM: non-linear (a), linear pseudo-order 1, (b), linear pseudo-order 2 (c), linear Elovich (d).
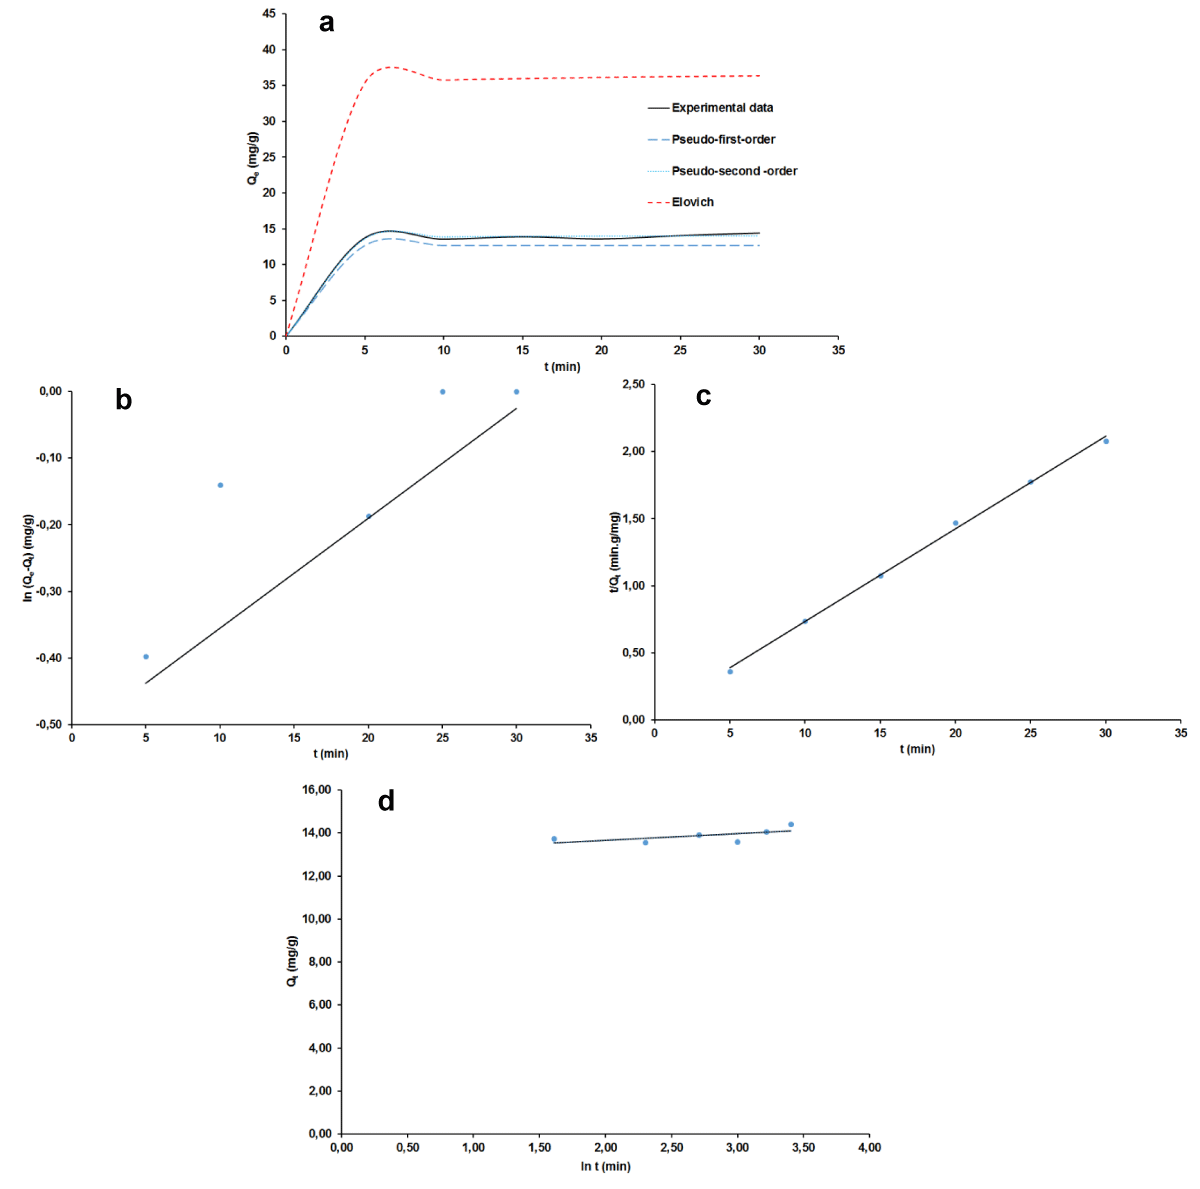
Figure 10: Adsorption kinetics plots for AG: non-linear (a), linear pseudo-order 1 (b); linear pseudo-order 2 (c), linear Elovich (d).
| Table 3: Non-linear kinetics constants for the adsorption of MB and AG on nano-silica. | |||
| Kinetics Models | Kinetics constants | ||
| Pseudo-first-order | BM | AG | |
| qe (mg.g-1) | 36.082 | 12.693 | |
| k1 (min-1) | 4.836 | 4.811 | |
| R2 | 0.984 | 0.937 | |
| RMSE | 1.913 | 1.342 | |
| χ2 | 0.507 | 0.716 | |
| Pseudo-second-order | qe (mg.g-1) | 38.437 | 14.089 |
| k2 (g.mg-1.min-1) | 0.032 | 0.395 | |
| R2 | 0.996 | 0.997 | |
| RMSE | 0.920 | 0.290 | |
| χ2 | 0.120 | 0.030 | |
| Elovich | A (mg.g-1.min-1) | 9.98 x 1026 | 9.98 x 1026 |
| B (mg.g-1) | 1.818 | 1.818 | |
| R2 | 0.988 | 0.191 | |
| RMSE | 1.645 | 24.233 | |
| χ2 | 0.381 | 81.542 | |
Comparison of the result obtained in this study with other published works
Table 4 displays a comparative value of the adsorption capacity of nano-silica used in this work with those of other materials available in the literature. The removal performance of nano-silica adsorbent for azocarmine G is fair compared to those of many other adsorbents while remaining the highest for methylene blue. This is an interesting result regarding the potential use of this absorbent in the elimination of many types of compounds, precisely those that have one or more of the many functional groups contained in methylene blue. Concerning previous studies, each of the functions contained in methylene blue is sensitive to adsorption even if the carboxyl group has been demonstrated to have a dominant contribution [56].
| Table 4: Adsorption capacity of nano-silica” for MB and AG and those of other adsorbents. | |||||
| Adsorbent | pH | Temperature (°C) | Initial concentration (mg.L-1) | Adsorption capacity (mg/g) |
Other works |
| PKSAC/BVA | 2 | 27 | 20 | 12.642 | Tabi, et al, 2021 |
| Nano-silica from kaolinitic clay | 1 | 27 | 50 | 41.3 | Current work |
| AC-FCBAC | 8 | 25 | 50 | 47.32 | Pathania, et al. 2017 |
| Natural clay | Neutral | 25 | 100 | 50.25 | Mohammad IK. 2020 |
| AC-NH2 | 5 | 27 | 50 | 53.33 | Lekene, et al. 2021 |
| BCM | 6.67 | 29 | 50 | 89,41 | Kifuani, et al. 2018 |
| Ch-V | 10.2 | 25 | 500 | 175.1 | Zeynep, et al. 2020 |
| viscose-based activated carbon fiber felts: |
6.0 | 30 | 100–500 | 325.83 | Liu, et al. 2019 |
| Nano-silica from kaolinitic clay | 11 | 27 | 50 | 7580.1 | Current work |
The investigation of the adsorption capacity of a novel nano-silica, greenly synthesized from natural kaolinitic clay, for the removal of MB and AG resulted in the following conclusions:
1) The adsorption capacity is 7580.1 mg/g for methylene blue and 50 mg/g for azocarmine G in the optimum process parameters of contact time adsorbent/absorbate of 15 minutes, pH of 11.0 for MB and 1.01 for AG;
2) linear and non-linear regression methods applied to isotherm and kinetic modeling of adsorption data for both adsorbates showed that the Freundlich isotherm model and pseudo-second-order kinetic model well describe the adsorption process;
3) The free energy of adsorption was similar, 0.71 kJ, for the two adsorbates, considering that it is the characteristic factor of the type of bond in chemical structures, it was asserted that the dominant adsorption mechanism was physisorption.
Above all, these results are indicative that nano-silica has high effectiveness in depollution.
The research was carried out using the facilities provided within the Research Grant TWAS No. 19-206 RGCHEAFAC_G – FR3240310124. The authors also wish to express their heartfelt gratitude to Professor Linda Leonie JEWELLI, Laboratory of Chemical Engineering, UNISA, South Africa, for her laboratory resources.
- Mohammad IK. Adsorption of methylene blue onto natural Saudi Red Clay: isotherms, kinetics and thermodynamic Studies. Mater Res Express 2020; 7: 055507.
- Hajjaji W, Andrejkovicová A, Pullar RC, et al. Effective removal of anionic and cationic by kaolinite and TiO2/kaolinite composite. Clay Miner. 2016;51:19–27.
- Tan IA, Ahmad AL, Hameed BH. Adsorption of basic dye on high-surface-area activated carbon prepared from coconut husk: equilibrium, kinetic and thermodynamic studies. J Hazard Mater. 2008 Jun 15;154(1-3):337-46. doi: 10.1016/j.jhazmat.2007.10.031. Epub 2007 Oct 13. PMID: 18035483.
- Pavithra KG, Kumar PS, Jaikumar V, et al. Removal of colorants from wastewater: A review on sources and treatment strategies. J Ind Eng Chem. 2019;75:1-19.
- Mahmoud ME, Nabil GM, El-Mallah NM, et al. Kinetics, isotherm and thermodynamic studies of the adsorption of reactive red 195 A dye from water by modified Switchgrass Biochar adsorbent. J Ind Eng Chem. 2016;37:156–167.
- Jingfei L, Yue S, Shu W, et al. Synthesis, Property Characterization and Photocatalytic Activity of the Polyaniline/BiYTi Polymer Composite. Polymers. 2017;9(69): 2-3.
- Yu K, Xiaoping Z, Shaoqi Z. Adsorption of Methylene Blue in Water onto Activated Carbon by Surfactant Modification. Water. 2020;12:587.
- Karaca S, Gürses A, Açikyildiz M, et al. Adsorption of cationic dye from aqueous solutions by activated carbon. Microporous Mesoporous Mater. 2008;115: 376–382.
- Dias EM, Petit C. Owards the use of metal–organic frameworks for water reuse: a review of the recent advances in the field of organic pollutants removal and degradation and the next steps in the field. J Mater Chem. 2015;3: 22484-22506.
- Oturan M, Aaron JJ. Advanced Oxidation Processes in Water/Wastewater Treatment: Principles and Applications. A Review. Criti Rev Environ Sci Technol. 2014;44(23): 2577-2641.
- Regulska E, Rivera-Nazario D, Karpinska J et al. Zinc porphyrin-functionalized fullerenes for the sensitization of titania as a visible-light active photocatalyst: river water and wastewaters remediation. Molecules. 2019;24(6): 1-17.
- Yu S, Liu M, Ma M, et al. Impacts of membrane properties on reactive dye removal from dye/salt mixtures by asymmetric cellulose acetate and composite polyamide nanofiltration membranes. J Membr Sci. 2010;350: 83-91.
- Asghar A, Abdul Raman AA, Wan D, et al. Advanced oxidation processes for in-situ production of hydrogen peroxide/hydroxyl radical for textile wastewater treatment: A review. J Clean Prod. 2015;87: 826–838.
- Kordouli E, Bourikas K, Lycourghiotis A, et al. The mechanism of azo-dyes adsorption on the titanium dioxide surface and their photocatalytic degradation over samples with various anatase/rutile ratios. Catal Today 2015;252: 128–135.
- Xiang Y, Gao M, Shen T, et al. Comparative study of three novel organo-clays modified with imidazolium-based gemini surfactant on adsorption for bromophenol blue. J Mol Liquids. 2019;286.
- Fan S, Wang Y, Wang Z, et al. Removal of methylene blue from aqueous solution by sewage sludge-derived biochar: Adsorption kinetics, equilibrium, thermodynamics and mechanism. J Environ Chem Eng. 2017;5: 601–61.
- Wang G, Wang S, Sun Z, Zheng S, Xi Y. Appl. Clay Sci. 2017;148: 1-10.
- Wang W, Huang G, An C, et al. Adsorption of anionic azo dyes from aqueous solution on cationic gemini surfactant-modified flax shives: Synchrotron infrared, optimization and modeling studies. J Clean Prod. 2018;172: 1986-1997.
- Hailu SL, Nair BU, Mesfin RA, et al. Preparation and characterization of cationic surfactant modified zeolite adsorbent material for adsorption of organic and inorganic industrial pollutants. J Environ Chem Eng. 2017; 5: 3319–3329.
- Joseph L, Jun BM, Flora JRV, Park CM, Yoon Y. Removal of heavy metals from water sources in the developing world using low-cost materials: A review. Chemosphere. 2019 Aug;229:142-159. doi: 10.1016/j.chemosphere.2019.04.198. Epub 2019 May 3. PMID: 31078029.
- Mohamed MM. Acid dye removal: comparison of surfactant-modified mesoporous FSM-16 with activated carbon derived from rice husk. J Colloid Interface Sci. 2004 Apr 1;272(1):28-34. doi: 10.1016/j.jcis.2003.08.071. PMID: 14985019.
- Leng L, Yuan X, Zeng G, et al. Surface characterization of rice husk bio-char produced by liquefaction and application for cationic dye (Malachite green) adsorption. Fuel. 2015;155: 77–85.
- Abdel-Fattah TM, Mohamed TM, Mahmoud E, et al. Biochar from woody biomass for removing metal contaminants and carbon sequestration. J Ind Eng Chem. 2015;22: 103–109.
- Mubarik S, Saeeda A, Athar MM, et al. Characterization and mechanism of the adsorptive removal of 2,4,6-trichlorophenol by biochar prepared from sugarcane baggase. J Ind Eng. Chem. 2016;33: 115–121.
- Rafatullah M, Sulaiman O, Hashim R, Ahmad A. Adsorption of methylene blue on low-cost adsorbents: a review. J Hazard Mater. 2010 May 15;177(1-3):70-80. doi: 10.1016/j.jhazmat.2009.12.047. Epub 2009 Dec 14. PMID: 20044207.
- Pathania D, Sharma S, Singh P. Removal of methylene blue by adsorption onto activated carbon developed from Ficus carica bast. Arab J Chem. 2017;10: 1445-1451.
- Qu X, Alvarez PJ, Li Q. Applications of nanotechnology in water and wastewater treatment. Water Res. 2013 Aug 1;47(12):3931-46. doi: 10.1016/j.watres.2012.09.058. Epub 2013 Mar 26. PMID: 23571110.
- Bhuvaneswari R, Nagarajan V, Chandiramouli R. Red tricycle phosphorene nanoribbon as a removing medium of sulfadiazine and sulfamethoxazole molecules based on first-principles studies. J Mole Liquids. 2021;336: 116294.
- Abu Al-Rub FA, Fares MM, Mohammad AR. Use of nanohybrid nanomaterials in water treatment: highly efficient removal of ranitidine. RSC Adv. 2020 Oct 8;10(61):37050-37063. doi: 10.1039/d0ra05530a. PMID: 35521255; PMCID: PMC9057075.
- Manikandan S, Karmegam N, Subbaiya R, Karthiga Devi G, Arulvel R, Ravindran B, Kumar Awasthi M. Emerging nano-structured innovative materials as adsorbents in wastewater treatment. Bioresour Technol. 2021 Jan;320(Pt B):124394. doi: 10.1016/j.biortech.2020.124394. Epub 2020 Nov 10. PMID: 33220545.
- Zinatloo-Ajabshir S, Mortazavi-Derazkola S, Salavati-Niasari M. Nd2O3-SiO2 nanocomposites: A simple sonochemical preparation, characterization and photocatalytic activity. Ultrason Sonochem. 2018 Apr;42:171-182. doi: 10.1016/j.ultsonch.2017.11.026. Epub 2017 Nov 21. PMID: 29429658.
- Şenol ZM, Gürsoy N, Şimşek S, Özer A, Karakuş N. Removal of food dyes from aqueous solution by chitosan-vermiculite beads. Int J Biol Macromol. 2020 Apr 1;148:635-646. doi: 10.1016/j.ijbiomac.2020.01.166. Epub 2020 Jan 18. PMID: 31958562.
- Ahmadian-Fard-Fini S, Ghanbari D, Amiri O, Salavati-Niasari M. Electro-spinning of cellulose acetate nanofibers/Fe/carbon dot as photoluminescence sensor for mercury (II) and lead (II) ions. Carbohydr Polym. 2020 Feb 1;229:115428. doi: 10.1016/j.carbpol.2019.115428. Epub 2019 Oct 3. PMID: 31826498.
- Tchanang G, Djangang CN, Abi CF, et al. Synthesis of reactive silica from kaolinitic clay: Effect of process parameters. Appl Clay Sci. 2021;207: 106087
- Altenor S, Carene B, Emmanuel E, Lambert J, Ehrhardt JJ, Gaspard S. Adsorption studies of methylene blue and phenol onto vetiver roots activated carbon prepared by chemical activation. J Hazard Mater. 2009 Jun 15;165(1-3):1029-39. doi: 10.1016/j.jhazmat.2008.10.133. Epub 2008 Nov 18. PMID: 19118948.
- Boumediene M, Benaïssa H, George B, et al. Effects of pH and ionic strength on methylene blue removal from synthetic aqueous solutions by sorption onto orange peel and desorption study. J Mater Environ Sci. 2018;9(6): 1700-1711.
- Sandotin LC. Abattement des phosphates des eaux usées par adsorption sur des géomatériaux constitués de Latérite, grès et schistes ardoisiers. Thèse en Co-Tutelle L’Université de Lorraine (UL) et de L’Université Nangui Abrogoua (UNA), 2014.
- Lekene RBN, Kouotou D, Ankoro NO, et al. Development and tailoring of amino-functionalized activated carbon based Cucumerupsi manni Naudin seed shells for the removal of nitrate ions from aqueous solution. J Saudi Chem Society. 2021;25: 101316.
- Kifuani KMA, Vesituluta P, Lopaka B, et al. Adsorption d’un colorant basique, Bleu de Méthylène, en solution aqueuse, sur un bioadsorbant issu de déchets agricoles de Cucumeropsis mannii Naudin. Int J Biol Chem Sci. 2018;12(1): 558-575.
- Kifuani KMA, Noki VP, Ndelo DPJ, et al. Adsorption de la quinine bichlorhydrate sur un charbon actif peu coûteux à base de la Bagasse de canne à sucre imprégnée de l’acide phosphorique. Int J Biol Chem Sci. 2012;6(3): 1337-1359.
- Ying Z. The application of TiO2 in the dye wastewater treatment. Dyeing Finishing Technol. 2005;27(11): 26-29.
- Jianhua J, Yun Li. Research on TiO2/UV-Fenton Catalytic Oxidation of Azocarmine G Dye Wastewater School of Civil Engineering & Architecture. Wuhan University of Technology Wuhan P R China. 2010;978(1): 4244-4713.
- Gnana K, Suggala V, King P. Equilibrium and thermodynamic studies of methylene blue biosorption from aqueous solution using Syzygium cumini L. J Environ Res Develop. 2014;8(04): 964-973.
- Madhavakrishman S, Manickavasagam K, Vasanthakumar R, et al. Adsorption of Crystal violet dye from aqueous solution using Ricinus communis pericarp carbon as adsorbent. E-J Chem. 2009;6(4): 1109-1116.
- Zhang L, Xu T, Liu X, Zhang Y, Jin H. Adsorption behavior of multi-walled carbon nanotubes for the removal of olaquindox from aqueous solutions. J Hazard Mater. 2011 Dec 15;197:389-96. doi: 10.1016/j.jhazmat.2011.09.100. Epub 2011 Oct 5. PMID: 22018864.
- Tabi GA, Lekene RBN, Kouotou D, et al. Non-linear modelling of the adsorption of Indigo Carmine dye from wastewater onto characterized activated carbon/volcanic ash composite. Arabian J Chem. 2022;15: 103515.
- Kumar KV, Porkodi K. Mass transfer, kinetics and equilibrium studies for the biosorption of methylene blue using Paspalum notatum. J Hazard Mater. 2007 Jul 19;146(1-2):214-26. doi: 10.1016/j.jhazmat.2006.12.010. Epub 2006 Dec 10. PMID: 17222969.
- Laximi GS, Ahmazzaman MD. Adsorption technique for the removal of phenolic compound from wastewater using low-cost natural adsorbents. Assam University J Sci Technol. 2010;5(2): 156-166.
- Nanseu-Njiki CP, Dedzo GK, Ngameni E. Study of the removal of paraquat from aqueous solution by biosorption onto Ayous (Triplochiton schleroxylon) sawdust. J Hazard Mater. 2010 Jul 15;179(1-3):63-71. doi: 10.1016/j.jhazmat.2010.02.058. Epub 2010 Feb 25. PMID: 20334968.
- Saeed A, Sharif M, Iqbal M. Application potential of grapefruit peel as dye sorbent: kinetics, equilibrium and mechanism of crystal violet adsorption. J Hazard Mater. 2010 Jul 15;179(1-3):564-72. doi: 10.1016/j.jhazmat.2010.03.041. Epub 2010 Mar 16. PMID: 20381962.
- Arivoli S, Nandhakumar V, Saravanan S, et al. Adsorptiondynamics of copper ion by low cost activated carbon. Arabian J Sci Eng. 2009;34(1A): 112.
- Sugana M, Siva KN, Venkata SM, et al. Removal of divalent manganese from aqueous solution using Tamarindus indica fruit nut Shell. J Hazard Mater. 2010;2(1): 7-20.
- Şenol ZM, Gürsoy N, Şimşek S, Özer A, Karakuş N. Removal of food dyes from aqueous solution by chitosan-vermiculite beads. Int J Biol Macromol. 2020 Apr 1;148:635-646. doi: 10.1016/j.ijbiomac.2020.01.166. Epub 2020 Jan 18. PMID: 31958562.
- Hakan D, ˙Ilknur D, Fatma T, et al. Adsorption of chromium(VI) from aqueous solution by activated carbon derived from olive bagasse and applicability of different adsorption models. Chem Eng J. 2008;144: 188-196.
- Aljamali, NM, Aldujaili, R AB, Alfatlawi, IO. Physical and chemical adsorption and its applications. Int J Thermodyna Chem Kinet. 2021;7(2): 1–8.
- Liu, F, Teng, S, Song, R, Wang, S. Adsorption of methylene blue on anaerobic granular sludge: effect of functional groups. Desalination. 2010;263(1-3), 11-17.