
More Information
Submitted: November 10, 2021 | Approved: December 16, 2021 | Published: December 17, 2021
How to cite this article: Karuppasamy MB, Natesan U, Periyasamy B, Srinivasalu S. Short-term environmental impact of ambient air quality trends in during the COVID-19 pandemic in India. Ann Civil Environ Eng. 2021; 5: 017-025.
DOI: 10.29328/journal.acee.1001031
Copyright License: © 2021 Karuppasamy MB, et al. This is an open access article distributed under the Creative Commons Attribution License, which permits unrestricted use, distribution, and reproduction in any medium, provided the original work is properly cited.
Keywords: Continuous ambient air quality; Air quality reduction; SARS-CoV-2 pandemic; Mortality rate; Lockdown impact

Short-term environmental impact of ambient air quality trends in during the COVID-19 pandemic in India
Manikanda Bharath Karuppasamy1,2* , Usha Natesan2, Balamadeswaran Periyasamy3 and Srinivasalu S1
1Institute for Ocean Management, Anna University, Chennai, Tamil Nadu, 600 025-India
2National Institute of Technical Teachers’ Training & Research (NITTTR), Chennai, Tamil Nadu, 600 025-India
3Department of Mining Engineering, Anna University, Chennai, Tamil Nadu, 600 025-India
*Address for Correspondence: Manikanda Bharath Karuppasamy, Institute for Ocean Management, Anna University, Chennai, Tamil Nadu, 600 025-India, Email: [email protected]
The lockdown, implemented in response to the COVID-19 epidemic, restricted the operation of various sectors in the country and its highlights a good environmental outcome. Thus, a comparison of air pollutants in India before and after the imposed lockdown indicated an overall improvement air quality across major Indian cities. This was established by utilizing the Central Pollution Control Board’s database of air quality monitoring station statistics, such as air quality patterns. During the COVID-19 epidemic, India’s pre-to-post nationwide lockdown was examined. The air quality data was collected from 30-12-2019 to 28-04-2020 and synthesized using 231 Automatic air quality monitoring stations in a major Indian metropolis. Specifically, air pollutant concentrations, temperature, and relative humidity variation during COVID-19 pandemic pre-to-post lockdown variation in India were monitored. As an outcome, several cities around the country have reported improved air quality. Generally, the air quality, on a categorical scale was found to be ‘Good’. However, a few cities from the North-eastern part of India were categorized as ‘Moderate/Satisfactory’. Overall, the particulate matters reduction was in around 60% and other gaseous pollutants was in 40% reduction was observed during the lockdown period. The results of this study include an analysis of air quality data derived from continuous air quality monitoring stations from the pre-lockdown to post-lockdown period. Air quality in India improved following the national lockdown, the interpretation of trends for PM 2.5, PM 10, SO2, NO2, and the Air Quality Index has been provided in studies for major cities across India, including Delhi, Gurugram, Noida, Mumbai, Kolkata, Bengaluru, Patna, and others.
The Corona Virus Disease (COVID-19) epidemic was first reported in Wuhan, China in December 2019, with human-to-human spreading causing severe acute respiratory syndrome [1]. The national curfew in India, imposed on March 24, 2020, at midnight, in response to the COVID-19 global epidemic, has resulted in a significant improvement in pollution levels in the country, as revealed by data analysis and comparison of data for time periods related to the commencement of restrictions, and the correlating periods of time as in previous year [2]. For India, the first case of COVID-19 was reported in Thrissur, Kerala on Jan 30, 2020, and consequently reported confirmed cases around 21,393 and total deaths 681 as of April 24, 2020. The lockdown was declared following a 14-hour mandatory restriction known as the “Janata curfew,” which was implemented on March 22, 2020. The national lockdown was extended on April 14, 2020, until May 3, 2020, with specific relaxations such as the opening of governmental departments, the functioning of industrial estates and Special Economic Zones (SEZs), building activities and brick kilns in rural regions, and etc [3]. These measures included the restriction of public from stepping out of home, the prohibition of all social, political, sports, entertainment, academics, cultural, and religious activities [4,5]. As a consequence, the transportation, industry, power plants, construction activities, biomass and waste burning, road dust resuspension, and residential activities are the primary contributors to air pollution. Furthermore, certain activities, including as the operation of Power stations, restaurant fires, landfill fires, and so on, contribute to air pollution [6,7]. Air quality has improved in several regions and cities around the country as a consequence of reduced emissions from different sources. The analysis of data gathered from CPCB-awarded research confirmed the conclusion that air quality levels reduced during the lockdown times [9]. Many mortalities are caused by air pollution, as are increasing cases of respiratory illness. The World Health Organization estimates that 4.6 million of people died every year as a result of diseases and illnesses induced by polluted air [10]. The particulate matter in few cities in India is much above the CPCB standards especially in metro cities like Delhi, Mumbai, Bengaluru, and Hyderabad [11,12]. The air quality regulation and actions to reduce air pollution were carried out following the prevention and Control of Pollution Act, 1981, and the Environment Protection Act, 1985. In November 2019, India was named within 50 most polluted cities world, with high levels of air pollution forcing schools to close and flights to be diverted (CNN) [13].
It has remained difficult due to limited air quality monitoring networks given its population size, with many communities and densely populated cities lacking access to real-time data. To reduce air pollution, the government implemented several initiatives that reduced particulate matter in 102 countries by 20% - 30% by 2024 when compared to 2017. To achieve this target, the National Clean Air Programme (NCAP) was launched by Ministry of Environment and Forests says that for the last 5 years concentrations of particulate matter are the major concern for India, with few variations in NO2 concentrations whereas the SO2 concentration with a standard limit. Greenpeace India’s analysis of Central Pollution Control Board (CPCB) data on April 11 revealed a large-scale reduction in air pollutant concentrations during the first ten days of the lockdown. There’s many attempted methods for improving air quality without having to put up obstacles to prevent emissions rates from rising when economies recover and the coronavirus crisis passes. The present study is an effort in this straight line to assess the usefulness of the lockdown as an alternative strategy to reduce air pollution. This study contributes to several current perspectives on COVID-19, and it used monitoring data to analyze air quality in India before and after the curfew.
The India is the world’s second most populated nation, located in the southern portion of the Asian region. It contributes for around 17.5% of the worldwide population and has the seventh-largest geographical area in terms of world landmass, with 32,87,263 km2. India has the most megacities in the world, defined as cities with a population of more than 10 million people, including Mumbai, Delhi, Kolkata, Bangalore, Chennai, and Hyderabad. The mean annual temperature in India is > 24 °C in the humid tropics, 17 °C to 24 °C in the subtropical region, 7 °C to 17 °C in the temperate regions, and 7 °C in the alpine zone. The ambient air quality data sets collected from the Continuous Ambient Air Quality Monitoring (CAAQM) program from 231 air quality monitoring stations was analysed for major cities of India its shows in Figure 1. Furthermore, CAAQM data for a few major metropolitan areas, including Mumbai, Bengaluru, Kolkata, Chennai, Indore, Patna, and Singrauli, was analyzed for the same time period mentioned above in order to get air quality estimates. The air quality data sets collected from 30-12-2019 to 28-04-2020 compared to before lockdown and after lockdown. Generally, the lockdown was classified different time periods such as Pre-lockdown phase (1st – 21st March 2020), Lockdown phase-I (25th March – 19th April 2020), and Lockdown phase-II (20th April – 3rd May 2020) have been investigated. While phase-II of the lockdown started on the 15th of April, as per government rules, because chosen further activities were permitted beginning on the 20th of April 2020, the lockdown phase-II timeframe has been considered. But since Janata curfew was established on March 22nd, 2020, and many states began implementing restrictions in the following days, the period from March 22nd to March 24th, 2020, was not evaluated. The regional data sets from continuous ambient air quality monitoring data by the Central Pollution Control Board-CAAQMS stations in India; Normally, we selected basic air pollutants such as particulate matter, gaseous pollutants and including meteorological data and AQI variation). It is intended to protect the ambient air quality monitoring instruments from dust and heat. A performance comparison for the corresponding periods in 2019 was also performed to determine the magnitude of progress during the lockdown periods. Because meteorology has a significant impact on air pollution levels, average wind speed and wind direction have been compared for major cities. Air Quality Index data from the CPCB bulletin have been studied to determine the country’s overall trend of improving air quality. The geospatial techniques were applied collected data sets from the COVID-19 cases. It is also essential to note that most cities have had their monitoring systems enhanced in the previous year. As a result of the availability of numerous stations in a city, spatial averaging may have an effect on pollutant concentration decrease or improvement.
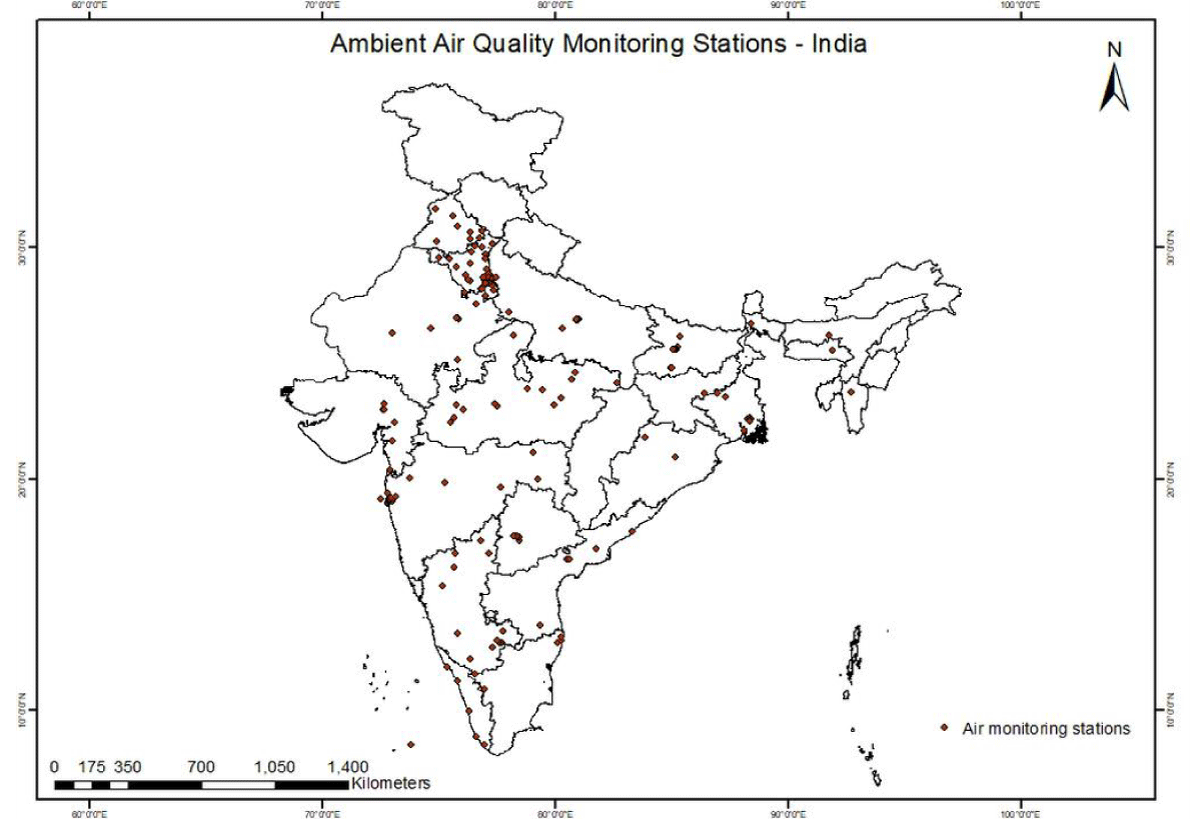
Figure 1: The sampling sites of continuous ambient air quality monitoring stations in India.
Analysis of continuous air quality monitoring data variation in India
Moreover, the new COVID-19 pandemic-led decreased air quality and may exacerbate possible respiratory issues since the National lockdown is released and companies’ operations are temporarily stopped, gradually normalizing emission levels [13,14]. The results of the final maps and data pre-processing show that the level of weather parameters has been drastically reduced, though this is only temporary. India, being the country that holds the 20 most polluted countries in the world due to its developmental activities, industrial implementation, populations give a stressful environment to the atmosphere which further increases the level of weather parameters from its normal level [9]. An average concentration of PM 2.5 PM 10, gaseous pollutants and AQI index continuously decreased. The variation of particulate matter and gaseous pollutants, normally shows more than 25 µg/m³ every year, but during COVID-19 lockdown time in April 2020 continuously decreased below 20 µg/m³. However, the government enacts numerous laws and engages in a variety of activities to reduce the level of poisonous gases released as a result of population stress and industrial activity. Significant reductions in PM2.5, PM10, and NO2 levels were recorded throughout both stages of the lockdown period as a consequence of a combination of decreased vehicles on the road, the functioning of only needed commercial units, and the prevailing weather conditions. This novel coronavirus outbreak in India made it possible by lowering the level of weather parameters in the atmosphere at a time when the entire country was under lockdown [14]. When compared to the same time periods last year, there was a significant improvement in air quality levels its shows Figure 2.
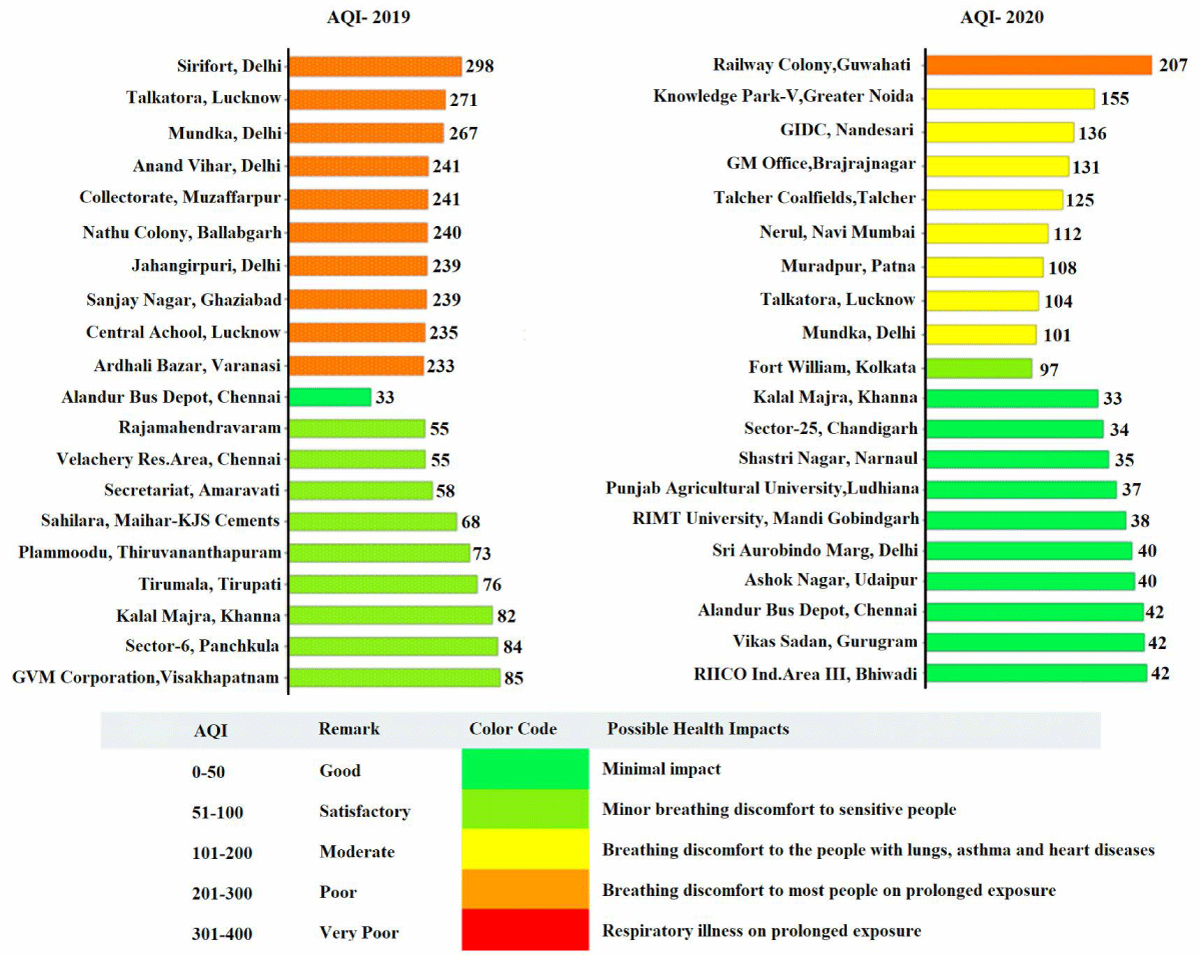
Figure 2: Air Quality Index variation Patterns in India (CPCB).
This has also been observed that air quality has improved during the pre-lockdown phase in 2020. Table 1 shows the air quality parameters in Indian megacities such as PM 2.5, PM 10, CO, NO2, SO2, O3, and AQI decrease during and before the COVID-19 lockdown periods. The Center for Pollution Control (CPCB) released a report on the air quality effects of the ‘Janata Curfew,’ which discovered that the decrease in the number of on-road cars made a significant contribution to a decrease of up to 51 percent in nitrogen oxide levels (NOx) and a 32 percent decrease in carbon dioxide (CO2) levels among 22-23rd March 2020 especially in contrast to 21st March 2020 [7]. It is also suggested that air quality in some cities has decreased under the prescribed National Ambient Air Quality Guidelines (NAAQS) of 60 g/m3, although remaining higher than the specified WHO standards of 25 g/m3) [9,15]. With concerns of particulate matter concentrations, while PM 2.5 decreased by 24% during the pre-lockdown period, it decreased by over 50% throughout both lockdown periods as compared to concentrations observed in 2019. When compared to the same time period in 2019, PM10 levels reduced by 60%, NO2 levels fell by 64%, and SO2 levels dropped by 35% during the second phase of lockdown. Pollution levels have also decreased as compared to pre-lockdown levels [19]. When compared to pre-lockdown values, there was a 38% and 33% drop in PM 2.5 and a 37% and 30% reduction in PM 10 during the lockdown phases I and II, respectively. SO2 levels decreased by 6% during lockdown phase I but remained close to pre-lockdown levels throughout lockdown phase II, owing to the operation of factories and industries.
| Table 1: Variation and changes air pollutants for pre and during the national lockdown in India (CPCB, India). | ||||||||||||
| Pollutants | Before Lockdown (March 2019) | During Lock Down (March 2020) | ||||||||||
| Delhi | Mumbai | Kolkata | Bengaluru | Chennai | Hyderabad | Delhi | Mumbai | Kolkata | Bengaluru | Chennai | Hyderabad | |
| PM 2.5 (μg/m3) | 183 | 148 | 167 | 81 | 81 | 74 | 97 | 25 | 85 | 54 | 25 | 44 |
| PM 10 (μg/m3) | 140 | 159 | 115 | 113 | 78 | 112 | 105 | 59 | 86 | 68 | 38 | 71 |
| CO (μg/m3) | 35 | 38 | 18 | 28 | 32 | 38 | 20 | 35 | 23 | 23 | 19 | 23 |
| NO2 (μg/m3) | 79 | 63 | 71 | 45 | 13 | 19 | 48 | 5 | 33 | 28 | 15 | 27 |
| SO2 (μg/m3) | 15 | 12 | 8 | 3 | 7 | 7 | 26 | 3 | 24 | 17 | 9 | 7 |
| O3 (μg/m3) | 68 | 68 | 57 | 169 | 34 | 31 | 28 | 16 | 134 | 99 | 51 | 32 |
| AQI | 183 | 159 | 167 | 169 | 81 | 112 | 105 | 59 | 134 | 99 | 51 | 71 |
The World Air Quality Report 2019 report considered air pollutants as the most harmful to humans in which India ranks 5th place with 58.1 µg/m3 where WHO has given of 10 µg/m3. This is because no Indian cities met the WHO target for annual pollution exposure during 2019 [11,18]. The variation of NO2 levels during the lockdown times has narrowed significantly, indicating the lack of significant sources. Despite the fact that 24 hourly NO2 levels stayed within NAAQS throughout the lockdown periods but the same periods in 2019, the highest 24 hourly NO2 value during the lockdown times was less than 50% of the maximum value measured during that period in 2019. The decision to lower limits comes as India’s government has already extended back the date for implementing NOx standards in power plants to 2022, owing to their failure to meet the increased criteria by the initial December 2017 period [10,11]. Such byproducts are known as nitrogen oxides (NOx), and they constitute a major contaminant. In India, it is estimated that NO2, a hazardous pollutant, causes 350,000 new instances of paediatric asthma and 16,000 early deaths per year [13]. Since summer has arrived, it is possible that power usage has grown as well. However, more evidence is required to establish a particular reason [19]. However, the reduction in concentrations is just temporary, this technique can be continued in the future days by repeating it for six months twice or once for two months. The extraordinary halt in human activity during the Lockdown has resulted in a considerable change in overall conditions in India. The knowledge gained from the COVID-19 epidemic can be used to select source-specific interventions that will result in the greatest improvement in ambient air quality. More than half of this pollution is caused by industry, with vehicles contributing for 27%, agricultural consumption responsible for 17%, and domestic heating accounted for 7%. With over 2 million Indians die as a result of air pollution-related diseases [12]. In metropolitan regions, vehicular traffic and industrial operations are the primary sources of pollution, but in rural areas, the primary cause of pollution is the combustion of organic waste. The northern region of India practises crop burning, wherein they waste their agricultural wastes in the fields and prepare their fields for a new crop of cultivations. This, together with other pollutants, ranks India third in the world in terms of greenhouse gas emissions, behind only China and the United States.
Scatter plot matrix and box-whisker plot assessments of air pollutant in India
The scatter plot matrix common tools describe the linear relationship between the variables. Every variable is arranged in such a way that it is either a predictive variable and a descriptive variable. In a certain sense, the graphical differing from the figure to a relationship of the variables. Bivariate connections between many variables including SO2, CO, O3, NO2, and particulate matters visualized in the scatter matrix plot are shown in Figure 3. So, each variable is loaded with different spread plots, a dependent variable, and a describing variable. The diagonal compounds cover a histogram at the variable in the corresponding column or row and its shows in Figure 3, and also, positive, and negative and non-significant correlations. A scatter plot shows a p - value < 0.05 (*) or a p - value is < 0.01 (**) positive-negative correction is mentioned above each plot of distributed linear fit is mentioned above each plot of the distributed linear fit of the variables and distribution of each variable and strong significance shown in the histogram. The major changes that were observed during the process of this study were the variations in the PM10, NO2, SO2, O3. It is said that the quality of air is improving due to the reduction in the mobility, and lockdown of an industries [15]. The above scenario may decrease global warming across the country, but [16] stated the weather is unfavourable, reducing industrial emissions will not be adequate to avoid severe air pollution events. Air quality patterns have seen air pollution increase day by day as human activity increase, making it critical to study pollution across a nation. Because of the Novel Corona Epidemic, which began in 2019, major governments across the world have implemented lockdown measures to prevent the spread of the worst virus. This lockdown policy imposed many regulations and stringent limitations on individuals, requiring them not to leave their homes and filtering unneeded activities, vehicle movements, and industrial activity. So, it would be a valuable lesson for us to evaluate the air quality of a routine year with those of a lockdown year to frame an idea about pollution levels, which will form a main aspect that unplanned and unregulated anthropogenic activities are really the major source of air pollution rather than natural sources.
As shown in Figure 3, we always include a predictor/independent variable. Such plots provide an easy way to see the important properties of the dependency structure: the dispersion of points is related to the frequency of connection, the shape of the clouds will assist in selecting an appropriate family of groups, and the behaviour in the upper right-hand corner of each plot of dispersion provides qualitative details regarding tail dependency. The result showed that CO correlated positively with other air pollutants as SO2, NO2, particulates matters PM 2.5 and PM 10 from the ranges 0.193;0.250; 0.089; 0.068 (**), and negatively correlated with O3 (-0.034) shown in Figure 3. Similarly, the O3 positively correlated with SO2 (0.83**) and NO2 (0.047*), moderately correlated with PM 2.5 (0.012) and negatively correlated with PM 10 (-0.015). Further the PM 10 negatively correlated only in O3 pollutants. The percentages of pollutants such as SO2, NO2, and PM 2.5 were consistently shown to be positively correlated with others. The box whisker plots illustrate that the top and bottom of box indicate the 75th and 25th percentiles, respectively, while the upper and lower whiskers reflect the 90th and 10th percentiles, respectively. The concentration ranges are following order PM2.5>PM10>NO2>SO2>CO>O3. The statistical summary and 75th percentile and 25th percentile was shown in Figure 4 and the air quality index was shows in Figure 4a. As reported in the source apportionment study conducted by CPCB 2019, during summers, dust & construction activities (35%), transport sector (20%), and industry (20%), are a major source of particulate matter in Delhi. The on-road vehicles were relatively sparse compared to normal days thus contribution from road dust resuspension & transport sector was much reduced; In general, the air pollution was contributing to the major sector of industries, transport, biomass & refuse burning, power plants, road dust resuspension, construction, and residential activities. But this lockdown introduced to many sources of air pollutants indicates the natural condition to observe the air quality reduction was in temporarily and higher impacts on socio-economic costs).
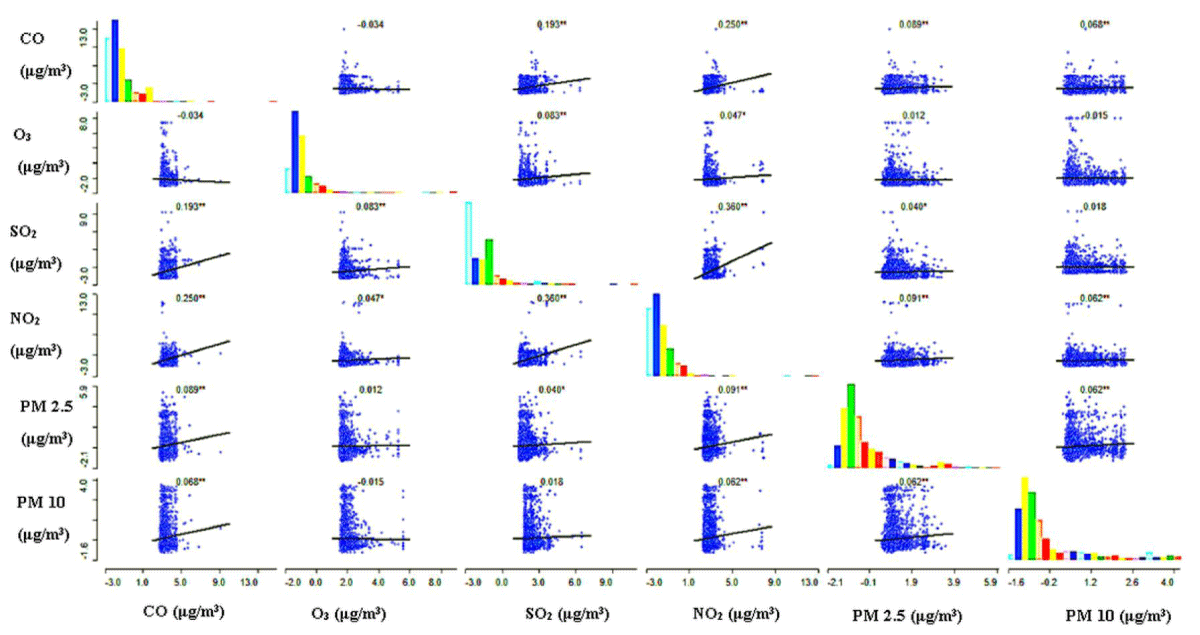
Figure 3: Scatter plot matrix major air pollutants in India.
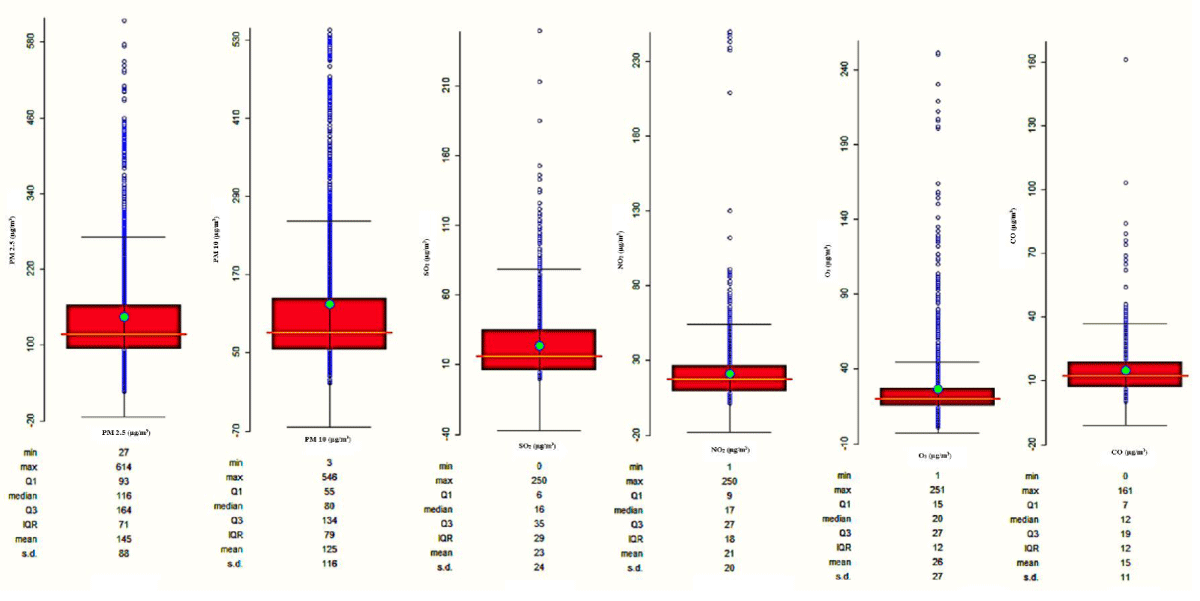
Figure 4: The box whisker plots of major air pollutants in across the India.
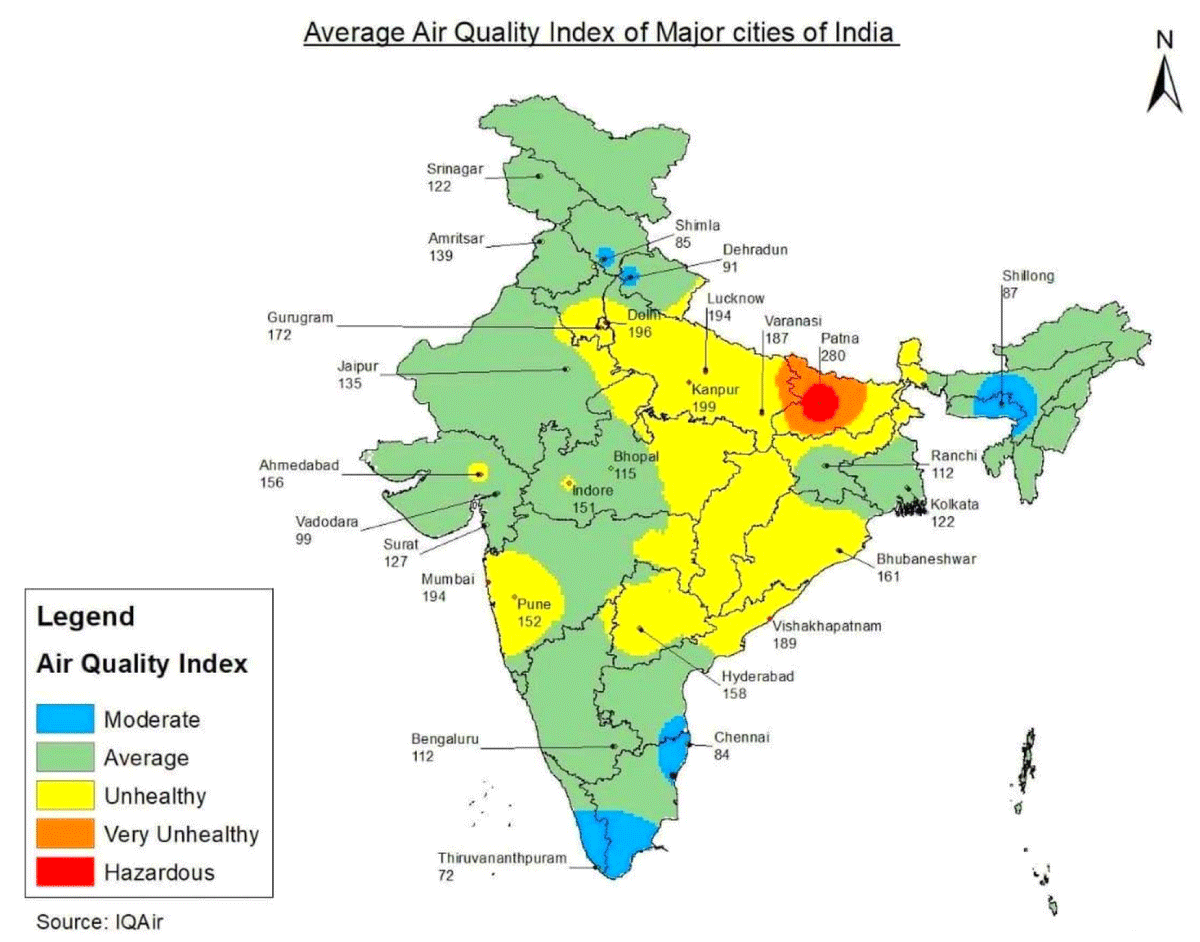
Figure 4a: An average ambient air quality index of the major metropolises in India
Distribution of SAR-CoV-2 cases in India
During the Coronavirus disease (COVID-19) lockdown periods, air pollution was reduced and air quality improved, resulting in better environmental quality and a lower population mortality rate. Figure 5 depicts the distribution of active conformed, recovered, and decreased COVID-19 cases. According to [17] conducted the study across Europe wherein the concentration of NO2 together with downwards airflow leads to NO2 build-up close to the environment preventing in the escape of air pollutants resulting in chronic exposure in turn leading to high COVID-19 fatality rates. The COVID-19 cases based on active, confirmed, recovered, and decreased rate was shows in Figure 5 and also the population density of the India was given in Figure 5a. The population density was positively correlated and reflect with the active confirmed cases of SARS-CoV-2 cases zone. According to the findings, the majority of those affected live in major metropolises such as Maharashtra, Mumbai, and Chennai. However, approximately 40% of reported cases occur in rural areas of India’s northeast and southwest. Because of the limited testing and the number of verified deaths may not be an exact estimate of the total number of COVID-19 deaths due to attribution difficulties of the instances of death. According with World Health Organization (WHO), seven million people are dying each year as a result of increased air pollution, and nine out of ten people breathe polluted air. Approximately 80% of people living in cities are exposed to air quality that exceeds the WHO standards for air quality [4]. One of the factors contributing to the COVID-19 death rate is due to the poor air quality (Wu, et al. 2020). Pre-existing medical problems (respiratory and cardiovascular) in India also increase the chance of mortality its shows in Figure 5. Healthy environment may lower the death rate from COVID-19 during national lockdown times [20]. While improving air quality and implementing national lockdown measures to prevent and contain the COVID-19 epidemic. Consequently, the quantitative evaluation of air pollution needs to be carried out to understand the impact of the air quality lock-down steps, especially where these alternative control measures are needed.
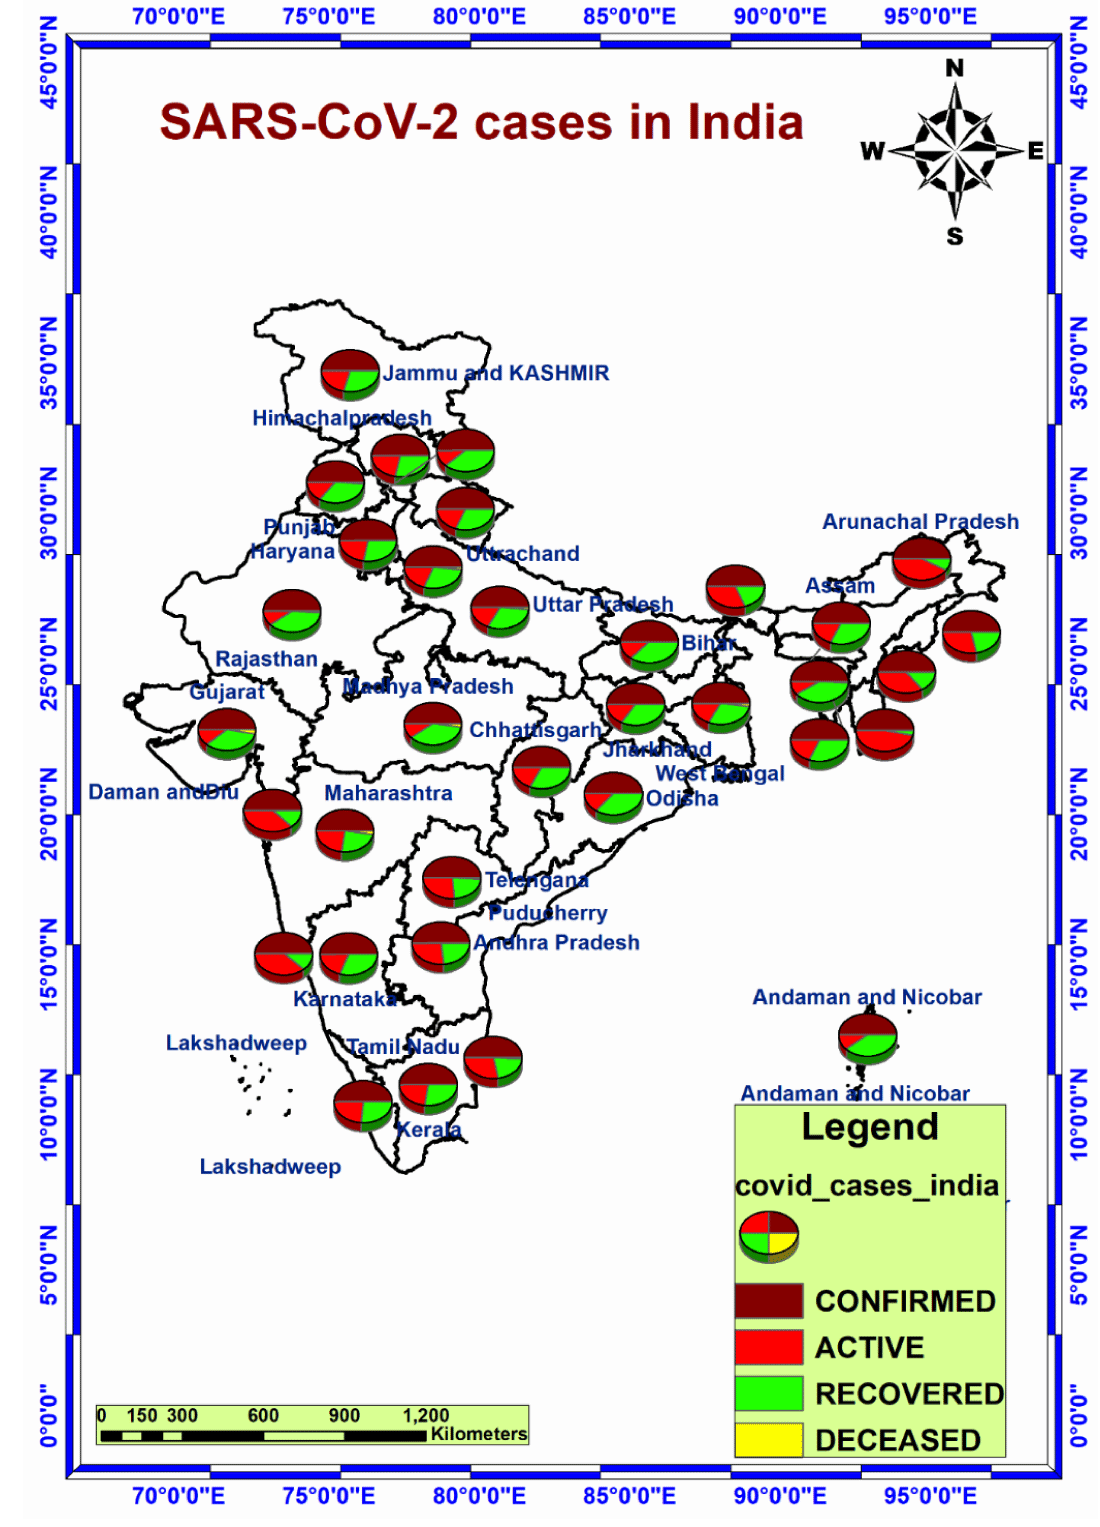
Figure 5: The distribution of active conformed recovered and decreased COVID-19 cases across India.
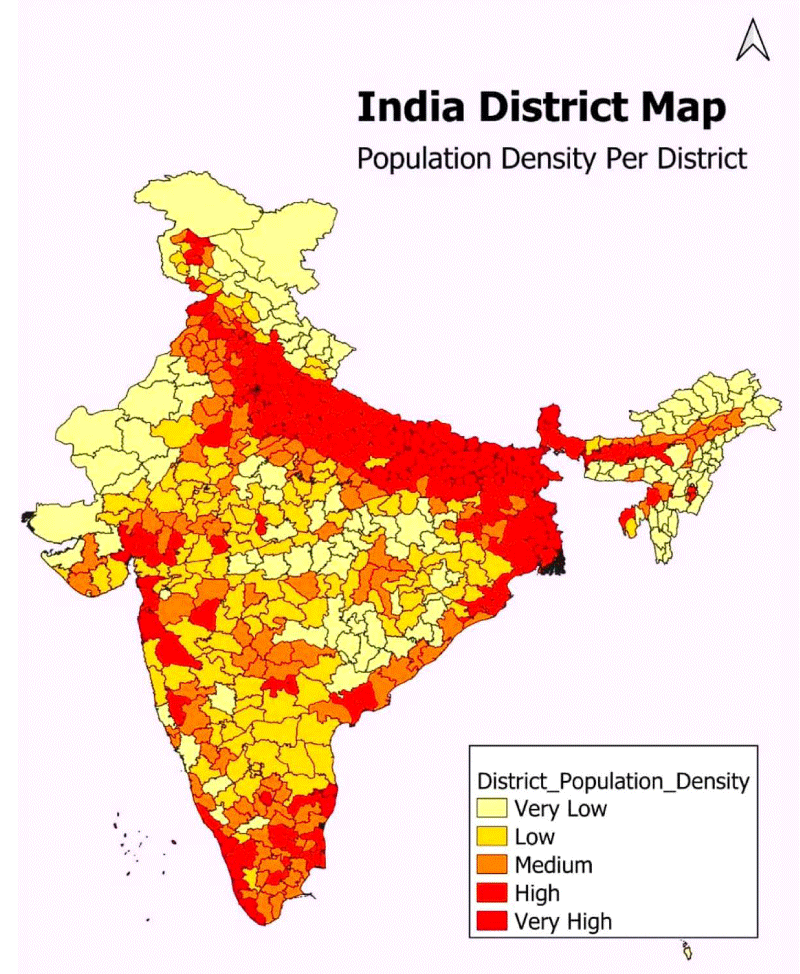
Figure 5a: The district wise population density map of India.
This study examined the impact of pollution reductions owing to less anthropogenic involvement across India during the COVID-19 epidemic. Although there was a major improvement in air quality due to reduced human activity during lockdown, such air quality control techniques come at a high economic impact. Consequently, anthropogenic air pollution has improved air quality parameters, as well as climatic fluctuations, largely due to traffic and industrial activities. Meanwhile, the new COVID-19 pandemic-led decreased air quality and may create possible respiratory difficulties since the national lockdown is removed and industries’ operations are immediately halted, gradually normalized environmental impacts. It is critical to achieve high air quality levels by reducing irreversible emissions through sustainable process improvements and long-term goals. Furthermore, as the impact of diverse human activities is now being measured, activities that may be integrated into industry scenarios must be found, with a focus on reducing emissions at the source, such as dust reduction, automobile emissions, industrial operations, and so on. Many people believe that the spread of the Coronavirus has reduced air pollution and, in this system, you might potentially save a life.
The researchers would like to express their gratitude to the Central Pollution Control Board, the Ministry of Environment, Forest and Climate Change (MoEFCC), and the Ministry of Human Resources and Development of the Government of India. Researchers gratefully acknowledge the World’s Air Pollution: Real-time Air Quality Index (WAQI project) for providing air quality statistics, as well as the COVID-19 cases and mortality rate of India acquired from WHO COVID-19 Portal.
Data availability
The datasets of this paper are available from the corresponding author on reasonable request.
- Ma Y, Zhao Y, Liu J, He X, Wang B, et al. Effects of temperature variation and humidity on the death of COVID-19 in Wuhan, China. Sci. Total Environ. 2020; 724: 138226. PubMed: https://pubmed.ncbi.nlm.nih.gov/32408453/
- CPCB. Impact of janta curfew & lockdown on air quality. Central Pollution Control Board (Ministry of Environment, Forest and Climate Change) Govt. of India, Delhi, 2020. PubMed: https://www.cpcb.nic.in/air/NCR/jantacurfew.pdf
- Balamadeswaran P, Karthik J, Ramakrishnan R, Manikanda Bharath K. Impact of COVID-19 outbreak on tropospheric NO2 pollution assessed using Satellite-ground perspectives observations in India. Model Earth Syst. Environ. 2021; 1-11. PubMed: https://pubmed.ncbi.nlm.nih.gov/33997263/
- Cadotte M. Early evidence that COVID-19 government policies reduce urban air pollution. 2020.
- Chen K, Wang M, Huang C, Kinney PL, Paul AT. Air Pollution Reduction and Mortality Benefit during the COVID-19 Outbreak in China. Lancet Planet Health. 2020; 4: e210-e212. PubMed:https://pubmed.ncbi.nlm.nih.gov/32411944/
- Jain S, Sharma T. Social and Travel Lockdown Impact Considering Coronavirus Disease (COVID-19) on Air Quality in Megacities of India: Present Benefits, Future Challenges, and Way Forward. Aerosol Air Qual. Res. 2020; 20: 1222–1236.
- Liu F, Page A, Strode SA, Yoshida Y, Choi S, et al. Abrupt declines in tropospheric nitrogen dioxide over China after the outbreak of COVID-19. Sci Adv. 2020; 6: eabc2992. PubMed: https://pubmed.ncbi.nlm.nih.gov/32923601/
- Liu J, Zhou J, Yao J, Zhang X, Li L, et al. Impact of meteorological factors on the COVID-19 transmission: A multi-city study in China. Sci Total Environ. 2020; 726: 138513. PubMed: https://pubmed.ncbi.nlm.nih.gov/32304942/
- Mukherjee A, Babu SS Ghosh S. Thinking about water and air to attain Sustainable Development Goals during times of COVID-19 Pandemic. J Earth Syst Sci. 2020; 129: 180. https://www.ncbi.nlm.nih.gov/pmc/articles/PMC7456204/
- https://www.who.int/docs/default-source/coronaviruse/situation-reports/20200404-sitrep-75-covid-19.pdf?sfvrsn=99251b2b_2
- IQAir 2019. World Air Quality. World Air Quality Report. 2019; 1–22. https://www.iqair.com/world-most-polluted-cities/world-air-quality-report-2019-en.pdf
- Zhang M, Katiyar A, Zhu S, Shen J, Xia M, et al. Impact of reduced anthropogenic emissions during COVID-19 on air quality in India. Atmos. Chem. Phys. 2020.
- Manikanda Bharath K, Srinivasalu S, Ayyamperumal R, Karuppannan S, Gopalakrishnan G, et al. Air pollution improvement and mortality rate during COVID-19 pandemic in India: global intersectional study. Air Qual Atmos Health. 2020; 13, 1375–1384.
- Ogen Y. Assessing nitrogen dioxide (NO2) levels as a contributing factor to coronavirus (COVID-19) fatality. Sci Total Environ. 2020; 726: 138605. PubMed: https://pubmed.ncbi.nlm.nih.gov/32302812/
- Pansini R, Fornacca D. Initial evidence of higher morbidity and mortality due to SARS-CoV-2 in regions with lower air quality. medRxiv. 2020; 04.04.20053595.
- Bagayaraj M, Karuppannan S, Mengistie AT, Ranganathan M, Gopalakrishnan G. Distribution and Trend Analysis of COVID-19 in India: Geospatial Approach. J Geogr Studies. 2020; 4: 1-9.
- Venter ZS, Aunan K, Chowdhury S, Lelieveld J. COVID-19 lockdowns cause global air pollution declines with implications for public health risk. MedRxiv. 2020.
- Wang P, Chen K, Zhu S, Wang P, Zhang H. Severe air pollution events not avoided by reduced anthropogenic activities during COVID-19 outbreak. Resour Conserv Recycl. 2020; 158: 104814. PubMed: https://pubmed.ncbi.nlm.nih.gov/32300261/
- Shrestha AM, Shrestha UB, Sharma R, Bhattarai S, Thi Tran HN, et al. Lockdown caused by COVID-19 pandemic reduces air pollution in cities worldwide. Earth Ar Xiv. 2020.
- Huang X, Ding A, Gao J, Zheng B, Zhou D, et al. Enhanced secondary pollution offset reduction of primary emissions during COVID-19 lockdown in China. 2020; 8: nwaa137