
More Information
Submitted: August 10, 2021 | Approved: September 07, 2021 | Published: September 08, 2021
How to cite this article: Ghadami N, Deravian B, Deravian B, Takhtravan A, Mohammad S, et al. Investigation of snow load reduction in the industrial sheds roof design with photovoltaic systems by mathematical modelling, solar system evaluation, X-steel simulation and thermodynamic practices. Ann Civil Environ Eng. 2021; 5: 011-016.
DOI: 10.29328/journal.acee.1001030
Copyright License: © 2021 Ghadami N, et al. This is an open access article distributed under the Creative Commons Attribution License, which permits unrestricted use, distribution, and reproduction in any medium, provided the original work is properly cited.
Keywords: Industrial shed; Solar panels; Photovoltaic system; Thermodynamic evaluation; Green energy supplying

Investigation of snow load reduction in the industrial sheds roof design with photovoltaic systems by mathematical modelling, solar system evaluation, X-steel simulation and thermodynamic practices
Nasim Ghadami1, Bita Deravian2, Behzad Deravian3, Amir Takhtravan4, Seyed Mohammad Khatibi5 and Mohammad Gheibi6*
1Department of Civil Engineering, Islamic Azad University, West branch of Tehran, Iran
2Department of Civil, Water and Environmental Engineering, Shahid Beheshti University, Tehran, Iran
3Department of Artificial Intelligent, Bright Talent Group of Computer Science, Tehran, Iran
4Department of Civil Engineering, Birjand University of Technology, Iran
5Department of Electrical Engineering, Shahid Montazeri University, Mashhad, Iran
6Department of Civil Engineering, Ferdowsi University of Mashhad, Mashhad, Iran
*Address for Correspondence: Mohammad Gheibi, Department of Civil Engineering, Ferdowsi University of Mashhad, Mashhad, Iran, Email: [email protected]
Since snow load is one of the loads of designing the industrial shed roof, this research presents a new system to reduce the industrial sheds roof design. In this system, sensitive units of moisture and temperature, which can be adjusted with different areas, are installed on the shed’s roof. The mechanism of system is that the sensors in the units detect the presence of snow on the shed roof and send an order to connect electricity to the elements; therefore, the snow on the roof melts by the heat generated. In this system, solar panels are used to supply electricity. As with the help of this mechanism, snow does not remain on the roof, it is possible to eliminate the snow load in the calculations of the shed and apply at least the live load of the sixth regulation (Due to having a one-story shed, minimum live load applied and it used only for the foundation design of the structure.), this issue will create an economic plan in shed designing. According to the study conducted in this research, it is shown that the dimensions of the sheet beam used in the shed are reduced, which will significantly reduce the cost of construction and installation to some extent. In the following, two samples of sheds with a span of 20 meters in the presence of snow and the absence of snow in the software were modelled, and the results were compared with each other.
With the development of societies and countries, the need to use environmentally friendly energy in various industries increases. On the other hand, the lack of resources and pollution from artificial resources has destroyed the environment and looted its non-renewable resources. This research presents a new mechanism to convert solar energy into heat energy to so that melts the snow accumulated on the shed roof. Thus the snow loads would be removed in the structural design calculation, and with the design load reduction, the lighter sections would be considered, which is economical. A new mechanism for economic and structural changes in the shed design has been presented in this research. One of the most important advantages of the proposed design is economical design of the shed by lightening its structural weight. Lightweight structure also has positive effects in the field of construction, assembly and installation on-site, saving time and positive seismic effects [1-5].
By using H.S.S construction sections in the construction of sheds, significant time and cost of construction can be saved. These new structures, while weighing less, have a higher torsional strength than conventionally built sheds. Another important advantage of these sheds is the elimination of the architectural limitations caused by the protrusion of the column haunch in the conventional construction method of the sheds. Most steel structural manufacturers, due to their ease of use, prefer to use ST37 quality steel in steel structural construction operations. While in the industrial production method of H.S.S construction sections, higher quality steels such as ST44 and ST52 steels can be used, which saves 17% to 27% in the total weight of the structure. Meanwhile, the price of ST44 and ST52 steels is about 2 to 3 per cent higher than ST37 steels [6-8].
Other researches include an article entitled “Optimization of industrial bridges and sheds construction using a combination of different steel grades used in plate girder components”), which this study refers to the selection of variables of steel grade, And suggests that by choosing steel type ST37 (steel with less resistance) in less load-bearing components and ST52 (steels with higher yield strength) in more load-bearing components, the total weight of steel used in single-span sheds and multi-span sheds reduces in comparison with using only mild steels, 53.22% and 11.18%, respectively, and in comparison with using only high-strength steels, by 3.10 and 12.9, respectively. This research is related to the selection of initial parameters in casting and its effects on structural properties [9-11].
This study is the first parameter is the casting and its impact on structural properties.
The project is divided into several sections: solar systems, thermal load, structural analysis and arrangement of elements:
Solar system
Components of the solar system can be divided into the following 3 sections:
Solar Cells: There are different types of solar cells, which are generally divided into three categories in terms of differences in construction and operation:
A) Polycrystalline b) Monocrystalline c) Amorphous silicon
However, it should be considered that if an obstacle prevents the radiation of light to the surface of mono and poly cells, this will lead to the output voltage reduction of the cells. In this research, amorphous panels are selected according to the environmental condition of solar cells which the main purpose of their installation in this project is to reduce snow load because these panels give a more comprehensive response to energy needs in adverse weather conditions.
Parameters affecting the production capacity of solar panels can be examined in the following 3 factors:
A) Load intensity of solar energy: I (direct relationship)
B) Surface size of solar cells: A (direct relationship)
C) Cell temperature: T
Laboratory experience has shown that in the design and arrangement of solar panels, using several small solar panels with series connections gives better results than the use of one large solar panel. If the average output voltage of small panels, which have standard dimensions in the market, (0.5 is considered, the output voltage of the panels is calculated as follows) [12-14].
Equation 1
Output voltage = (number of series cells) * 0.5
Electronic power converter: As mentioned, electronic power converters or inverters can have 3 modes AC-DC, DC-DC and DC-AC depending on the type of consumer. These converters are available in two types of reducers and boosters. Since sometimes the designs require a voltage that is either more than the capacity of the circuit or cannot power the circuit, this converter has many uses.
The output voltage amount of the DC-DC converter circuit is obtained from the following Equation:
Equation 2
Equation 3
In the above relations Ton and T are the parameters of external load and temperature, respectively. Further explanation of this issue is beyond the scope of our discussion. In this research, according to the type of element used in the ceiling and the ability to change the voltage, a DC-DC converter has been used [15].
Energy storage batteries (charger batteries): One of the specifications of batteries is the amount of load stored in them, which is expressed in units A/h, for example, a 10 A/h battery (ampere per hour) can produce up to 3 hours of load required for 30A to produce and deliver it to the network. The output power of the batteries is calculated from Equation
P = V * I Equation 4 [16-18].
And it can be calculated according to the formula mentioned in Code 19 of the National Building Regulations based on Kcal/h:
Equation 5
Thermal load calculation (Q)
The required thermal energy for the industrial shed consists of two parts:
1 The heat required to melt the snow
2 The heat required to heat the industrial shed is obviously the priority of the design.
Calculation of required thermal load for melting snow (Q1): The heat generated due the snow load is calculated by the following formula:
Equation 6
Q1 = M*Lf
In the above relation, M is the mass of the molten material and Lf is the fusion latent heat coefficient. To create a reliability coefficient, the maximum value of M is taken into account, and this maximum value is obtained from the hydro-meteorological studies of each region [19-21].
Calculation of industrial shed heating need (Q2): The pattern of wall heat transfer in present study is illustrated in Figure 1.
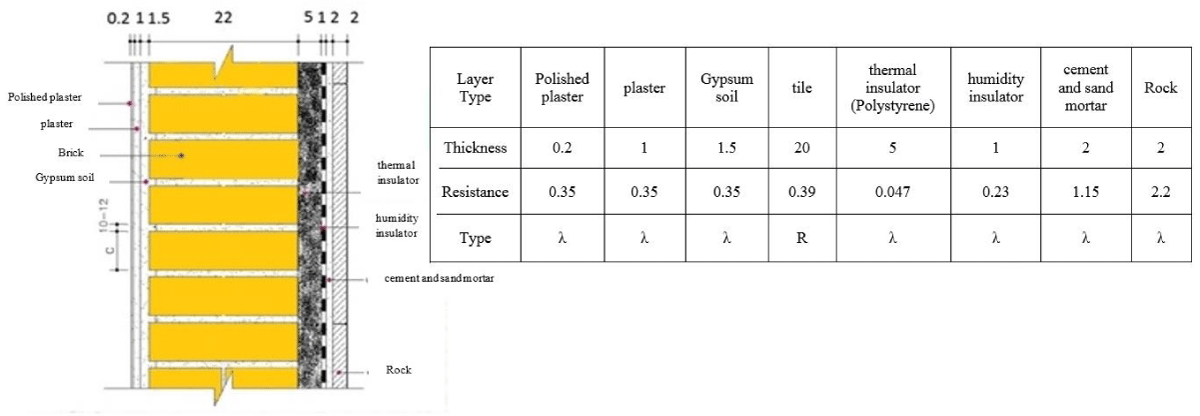
Figure 1: The schematic plan of utilized wall and heat transfer from it in present study.
Here we need to understand the wasted energy amount which in relation to it we have:
Equation 7
Q = AU(θ1 - θ2)
Equation 8
Equation 9
In Equation (7), A and U are the cross section perpendicular to the thermal flow passage and the thermal conductivity, respectively. In relation to U we must note that this coefficient is the inverse of the thermal resistance and is obtained from Equation (8).
In this Equation, fi is the air thermal resistance inside and outside of the shed and Ri is the wall components resistance, which the resistance parameter obtained from Equation (9) and is its unit. All this information is taken from Code 19 of the National Building regulation. The sum of the thermal energies Q1 and Q2 is called QT. QT is the required thermal energy which is provided by the solar system [22-25]. To make this mechanism smarter, a programmed system with MATLAB has been used. In this program, based on hydrological studies of each region, snow temperature gradient is obtained, in other words, two parameters of relative humidity and snow temperature are the starting point of the elements so that the solar energy absorbed by DC-DC converters is converted into electricity. And transferred to the elements and thus melt the accumulated snow. The written program calculates 2 required thermal energy outputs for the roof of the shed and the required heat energy for heating the shed. Units containing LN-35 (temperature and humidity sensitive) sensors have been used for intelligence. Another conditional factor in the program is that the heat flow induction rate from the elements in terms of what is obtained from the conversion (Equation 5) obtained from Equation P = V * I (Equation 4) to the average snowfall time obtained from hydrological studies of an area is restricted [26].
The elements arrangement
In determining the elements arrangement, it should be noted that due to the 11% slope of the sheds roof, the snow will be more concentrated in the corners of the roof. In designing and selecting the placement and arrangement of the elements, several models such as simple circle, longitudinal, Zigzag, and Circular circle (Figure 2) is considered. The purpose of geometric modeling of these shapes is to determine the best and most optimal arrangement of elements to achieve 2 goals:
1. The highest area of elements coverage
2. The lowest consumption of the elements
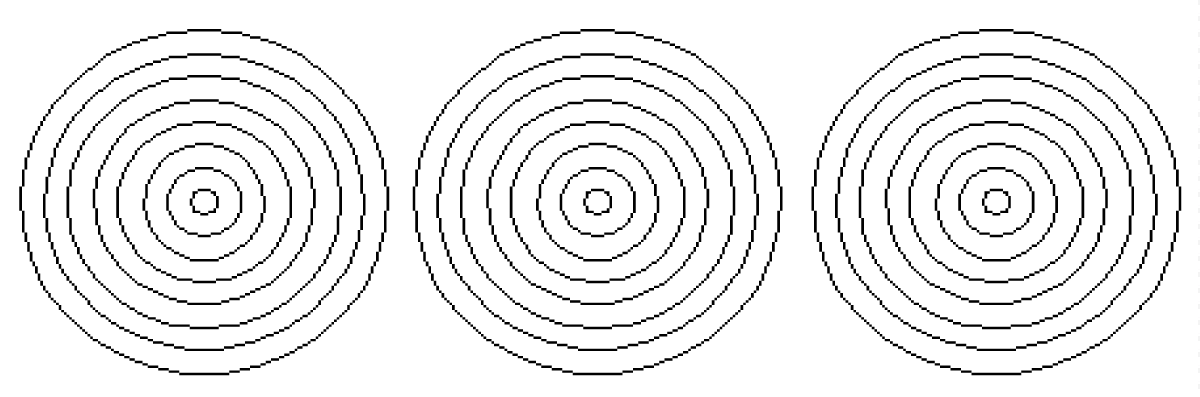
Figure 2: The schematic plan of solar elements arranges on the roof in present research. (Longitudinal arrangement of circular elements).
The mentioned examples have been converted into mathematical models and solved by simplex method. The results of these modeling’s show that the circular model has the highest coverage area and the lowest element consumption [27-30].
The obtained model is placed at distances of 0.5 m from the center to the center so that their inner radius reaches R = 8m and the difference in radius of two consecutive circles of the center reaches ∆R=1m, this can provide the optimal conditions for the arrangement of the element. Then, by using the approximate parameters of the heat function and limiting its variables to the experimental environmental conditions, we achieved that the concentric circle model is the best model of heat emission. In general, the heat Equation is expressed as , in which u is a function of heat emission in terms of the variables t (time) and x (place). We analyze this Equation by the method of separating variables from the methods of differential Equations, which may have 3 opposite states: 1) The finite object and boundary conditions are zero. 2) The object is infinite. 3) The object is semi-finite.
In this project, we select conditions (1) according to the environmental condition of the elements, and after analyzing it from the above method, we have the answer to the Equation:
Equation 10
Equation 11
n=1, 2, 3, ….
As per Figure 3, we simulated the answer from the u(x. t) Equation in MATLAB and acquired the following model according to the written program [31-33].
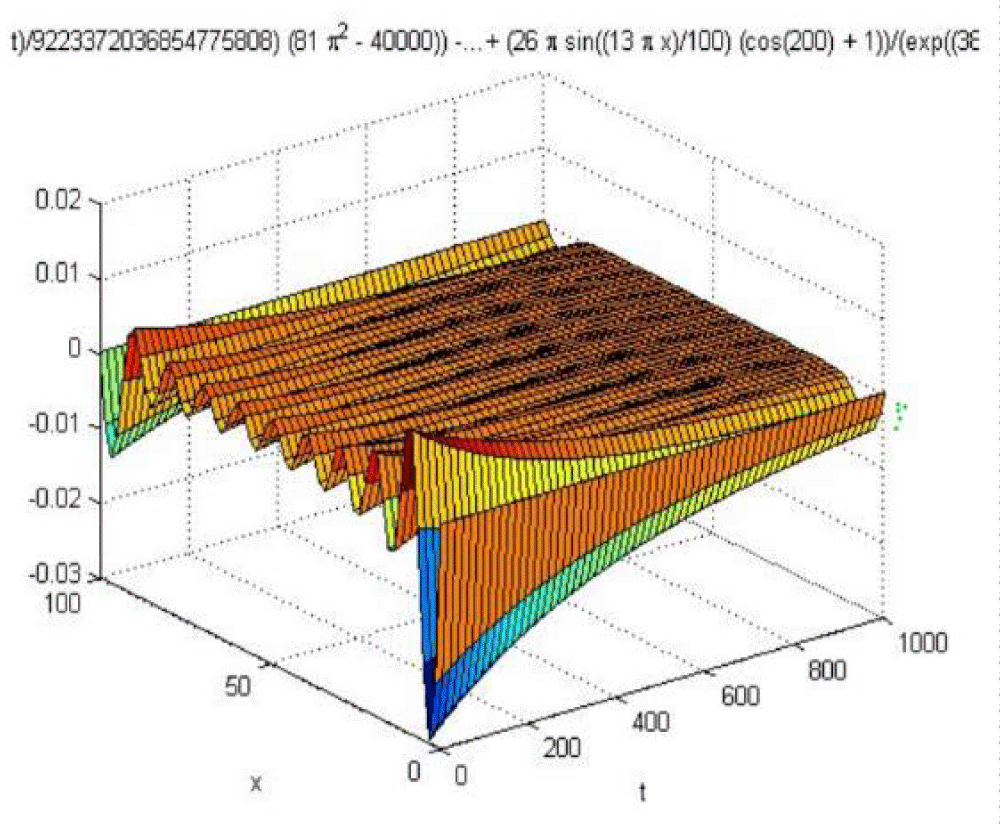
Figure 3: The trends of heat transfer in the roof of sheds in present research according to simulation outcomes.
The model shows that after the equilibrium time, we reach the thermal equilibrium, that is, the heat of melting snow. Based on the simulated models, we came to the conclusion that the ring model can be selected as the optimal model.
Structural analysis
To investigate the effect of reducing snow load on the structural sections, two sheds in the following 2 situations have been modeled in X-Steel software.
Status 1: The existence of dead and live loads due to wind and snow
Status 2: Existence of dead and wind loads and minimum live load specified in Code 6 of the National Building Regulations
Both industrial sheds have a span of 20 meters, a length of 30 meters, and the distance between their forms is 6 meters. The place of shed construction is considered in Mashhad.
It should be noted that the design snow load for the city of Mashhad based on hydrological studies of the Gamble distribution is considered to be 150 kg / m^2. Both sheds have been modeled in the software and have been analyzed and designed under the mentioned load [34,35].
Finally, the sections obtained for both sheds are compared with each other. The following Table 1 shows a comparison between the executive details of status (1) and status (2).
| Table 1: Comparison of solar based and conventional system in designing sheds. | ||
| Executive details (mm) | Status 1 | Status 2 |
| Thickness of form and column | PL10 | PL6 |
| Dimensions of form wings and column | PL250*12 | PL200*8 |
| Column flange dimensions to form | PL800*250*20 | PL800*200*15 |
| Form flange dimensions to form | PL350*200*15 | PL350*200*12 |
| Framing section | Z180 | Z160 |
According to Figure 4, the thickness of frame is reduced from PL10 to PL6 by solar system application. Moreover, the thickness of column plate is optimized from PL200*12 to PL200*8 with applying photovoltaic system. As per Figure 5, the size of Z shape in girder putting is changed from Z180 to Z160 by molding snow load by solar radiation. Finally, according to Figure 6, with putting solar systems in roof, the flange dimension is optimized from PL800*250*20 to PL800*200*15.
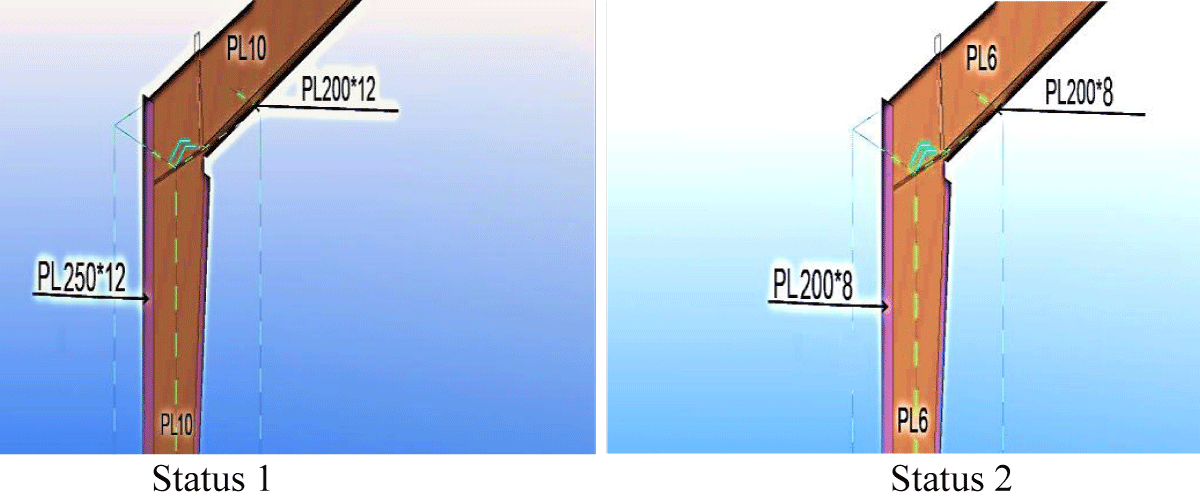
Figure 4: Comparison of column and frame details in both (Status 1) conventional and (Status 2) solar based design.
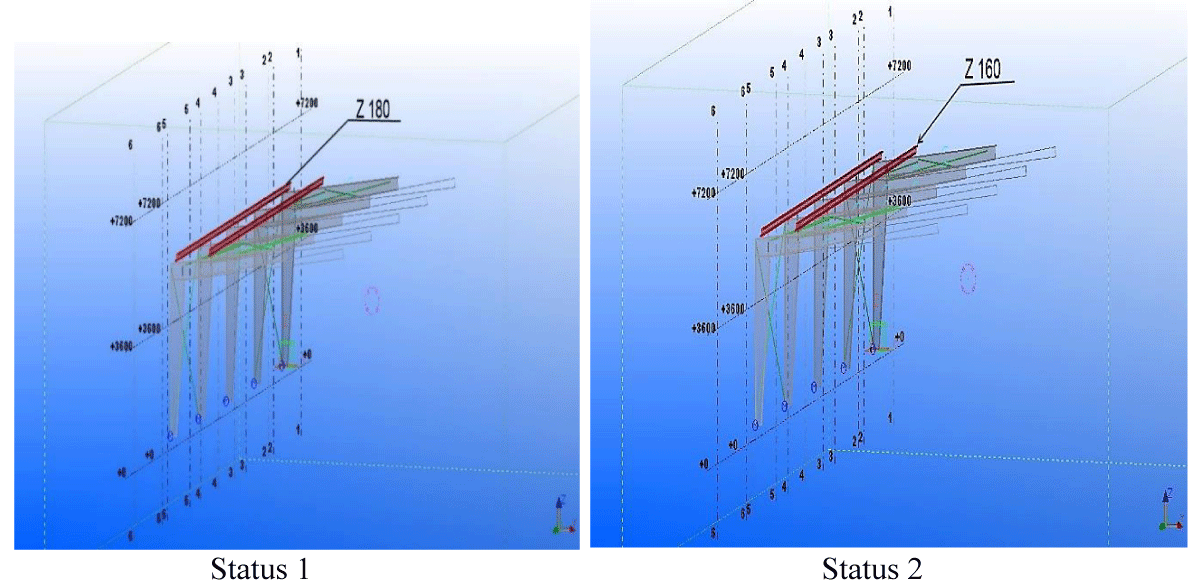
Figure 5: Comparison of framing on the sheds roof in both (Status 1) conventional and (Status 2) solar based design.
Figure 6: Comparison of column flange connection to form in both (Status 1) conventional and (Status 2) solar based design.
Author’s suggestion
We must note that by changing the general policies of the electricity company and, consequently, the government apparatus, this system can be made very economical. To illustrate this, we have a comparison between buying energy in Third World and First World countries; According to interviews with several citizens living in Europe, including Sweden, the electricity company and, consequently, government policies buy the provided energy created by the people at 3 times the price. It means that this system is inclusive in summer and spring, and even in some areas in autumn, it only generates 300% revenue, which is responsible for the costs of reviewing and replacing the system battery for 3 years due to reduced efficiency. In addition, it also includes income generation; this policy encourages people to use free and environmentally friendly free energy. In the hope that one day, with the increase of scientific projects to exploit solar energy in various sciences, the macro-policies of the country will move towards the exploitation of this divine blessing.
In this research, a new mechanism for optimizing the structure of sheds has been presented. Elements are installed in the roof of the shed with an optimally ordered arrangement, which converts solar energy into heat energy with the help of solar cells that are attached to it, and uses this heat to melt the accumulated snow on the roof of the shed. Due to this mechanism, snow does not remain on the shed roof. The snow load effects in the design of the shed can be ignored. In the presented numerical example, two sheds were analyzed and designed once under snow load and once without snow load. Numerical results show that the shed designed without snow load has smaller cross-sectional dimensions than the original shed. By comparing the cost construction of these two sheds, (in the first shed includes the weight of the structure with larger dimensions and in the second shed includes the weight of the structure with smaller dimensions and the cost of the solar system), a cost reduction of about 8% was obtained for the second shed. Finally, it should be noted that the results of this study show that designers and accounting engineers can use this mechanism to design optimal dimensions with a higher risk factor.
- Ghadami N, Gheibi M, Kian Z, Faramarz MG, Naghedi R, et al. Implementation of solar energy in smart cities using an integration of artificial neural network, photovoltaic system and classical Delphi methods. Sustaina Cities Soc. 2021; 74: 103149.
- Ghadami N, Siamaki M, Pouresmaeil H, Aghlmand R, Gheibi M. Assessing Energy Consumption, Optical Distributions, and Carbon Contaminations using the Design-Builder Simulation Model (Case Study: A Sports Building, Mashhad, Iran). Ann Environ Sci Toxicol. 2021; 5: 074-079. https://www.peertechzpublications.com/articles/AEST-5-140.php
- Bahramian F, Akbari A, Nabavi M, Esfandi S, Naeiji E. Design and tri-objective optimization of an energy plant integrated with near-zero energy building including energy storage: An application of dynamic simulation. Sustaina Energy Technolog Assess. 2021; 47: 101419.
- Taherahmadi J, Noorollahi Y, Panahi M. Toward comprehensive zero energy building definitions: a literature review and recommendations. Int J Sustaina Energy. 2021; 40: 120-148.
- Rabani M, Madessa HB, Nord N. Achieving zero-energy building performance with thermal and visual comfort enhancement through optimization of fenestration, envelope, shading device, and energy supply system. Sustaina Energy Technolog Assess. 2021; 44, 101020.
- Abdou N, Mghouchi YE, Hamdaoui S, Asri NE, Mouqallid M. Multi-objective optimization of passive energy efficiency measures for net-zero energy building in Morocco. Building Environ. 2021; 204: 108141.
- Guo J, Dong J, Wang H, Jiang Y, Tao J. On-site measurement of the thermal performance of a novel ventilated thermal storage heating floor in a nearly zero energy building. Building Environ. 2021; 107993.
- De Luca G, Ballarini I, Paragamyan A, Pellegrino A, Corrado V. On the improvement of indoor environmental quality, energy performance and costs for a commercial nearly zero-energy building. Sci Technol Built Environ. 2021; 1-19.
- Bal M, Stok FM, Van Hemel C, De Wit JB. Including Social Housing Residents in the Energy Transition: A Mixed-Method Case Study on Residents' Beliefs, Attitudes, and Motivation Toward Sustainable Energy Use in a Zero-Energy Building Renovation in the Netherlands. Front Sustaina Cities. 2021; 3, 25.
- Migliori Favaretto M. Modeling and Energy Simulation of a Zero Energy Building: A Case Study for Florida (Doctoral dissertation). 2021.
- Khassan А, Donenko VI, Ischenko OL. The use of BIM to achieve zero energy building. Metal Sci Heat Treat Metals. 2021; 1: 59-65.
- Woo J, Fatima R, Kibert CJ, Newman RE, Tian Y, et al. Applying blockchain technology for building energy performance measurement, reporting, and verification (MRV) and the carbon credit market: A review of the literature. Building Environ. 2021; 108199.
- Guo S, Yan D, Hu S, Zhang Y. Modelling building energy consumption in China under different future scenarios. Energy. 2021; 214: 119063.
- Ahmadi MM, Keyhani A, Kalogirou SA, Lam SS, Peng W, et al. Net-zero exergoeconomic and exergoenvironmental building as new concepts for developing sustainable built environments. Energy Convers Manage. 2021; 244: 114418.
- Rimec D. Multidimensional Assessment For a Case Studied Zero Energy Building: Climate positive buildings with and without a connection to the district heating network. 2021;
- Arabkoohsar A, Behzadi A, Alsagri AS. Techno-economic analysis and multi-objective optimization of a novel solar-based building energy system; An effort to reach the true meaning of zero-energy buildings. Energy Convers Manage. 2021; 232: 113858.
- Yu L, Qin S, Zhang M, Shen C, Jiang T, et al. A review of deep reinforcement learning for smart building energy management. IEEE Internet Things J. 2021.
- Li L, Sun W, Hu W, Sun Y. Impact of natural and social environmental factors on building energy consumption: Based on bibliometrics. J Building Eng. 2021; 102136.
- Kathirgamanathan A, De Rosa M, Mangina E, Finn DP. Data-driven predictive control for unlocking building energy flexibility: A review. Renewa Sustaina Energy Rev. 2021; 135: 110120.
- Chegari B, Tabaa M, Simeu E, Moutaouakkil F, Medromi H. Multi-objective optimization of building energy performance and indoor thermal comfort by combining artificial neural networks and metaheuristic algorithms. Energy Buildings. 2021; 239: 110839.
- Verhaeghe C, Verbeke S, Audenaert A. A consistent taxonomic framework: towards common understanding of high energy performance building definitions. Renewa Sustaina Energy Rev. 2021; 146: 111075.
- Deb C, Schlueter A. Review of data-driven energy modelling techniques for building retrofit. Renewable and Sustainable Energy Reviews. 2021; 144: 110990.
- Wang L, Lee EW, Hussian SA, Yuen ACY, Feng W. Quantitative impact analysis of driving factors on annual residential building energy end-use combining machine learning and stochastic methods. Applied Energy. 2021; 299: 117303.
- Luo XJ, Oyedele LO. Forecasting building energy consumption: Adaptive long-short term memory neural networks driven by genetic algorithm. Adv Eng Informat. 2021; 50: 101357.
- Hong Y, Yoon S, Kim YS, Jang H. System-level virtual sensing method in building energy systems using autoencoder: Under the limited sensors and operational datasets. Applied Energy. 2021; 301: 117458.
- Langevin J, Harris CB, Satre-Meloy A, Chandra-Putra H, Speake A, et al. US building energy efficiency and flexibility as an electric grid resource. Joule. 2021;
- Tian Z, Shi X, Hong SM. Exploring data-driven building energy-efficient design of envelopes based on their quantified impacts. J Building Eng. 2021; 42: 103018.
- Ghalambaz M, Yengejeh RJ, Davami AH. Building energy optimization using Grey Wolf Optimizer (GWO). Case Studies Thermal Eng. 2021; 27: 101250.
- Veiga RK, Veloso AC, Melo AP, Lamberts R. Application of machine learning to estimate building energy use intensities. Energy Buildings. 2021; 249: 111219.
- Liu B, Rodriguez D. Renewable energy systems optimization by a new multi-objective optimization technique: A residential building. J Building Eng. 2021; 35: 102094.
- Rodriguez A, Smith ST, Potter B. Sensitivity analysis for building energy audit calculation methods: Handling the uncertainties in small power load estimation. Energy. 2021; 238: 121511.
- Salom J, Tamm M, Andresen I, Cali D, Magyari Á, et al. An Evaluation Framework for Sustainable Plus Energy Neighbourhoods: Moving Beyond the Traditional Building Energy Assessment. Energies. 2021; 14: 4314.
- Yu H, Wang M, Lin X, Guo H, Liu H, et al. Prioritizing urban planning factors on community energy performance based on GIS-informed building energy modeling. Energy Buildings. 2021; 249: 111191.
- Bastos Porsani G, Del Valle de Lersundi K, Sánchez-Ostiz Gutiérrez A, Fernández Bandera C. Interoperability between Building Information Modelling (BIM) and Building Energy Model (BEM). Appl Sci. 2021; 11: 2167.
- Gulotta TM, Cellura M, Guarino F, Longo S. A bottom-up harmonized energy-environmental models for europe (BOHEEME): A case study on the thermal insulation of the EU-28 building stock. Energy Buildings. 2021; 231: 110584.