
More Information
Submitted: August 10, 2021 | Approved: September 07, 2021 | Published: September 08, 2021
How to cite this article: Chahkandi B, Gheibi M, Takhtravan A. Behavior evaluation of freundlich and langmuir isotherms in cadmium preconcentration using solid phase extraction method for linear and nonlinear numerical computational patterns. Ann Civil Environ Eng. 2021; 5: 007-010.
DOI: 10.29328/journal.acee.1001029
Copyright License: © 2021 Chahkandi B, et al. This is an open access article distributed under the Creative Commons Attribution License, which permits unrestricted use, distribution, and reproduction in any medium, provided the original work is properly cited.
Keywords: Cadmium; Solid phase extraction; Friendlich isotherm; Langmuir isotherm; Statistical distributions

Behavior evaluation of freundlich and langmuir isotherms in cadmium preconcentration using solid phase extraction method for linear and nonlinear numerical computational patterns
Benyamin Chahkandi1, Mohammad Gheibi2* and Amir Takhtravan3
1Department of Civil Engineering, University of Tehran, Iran
2Department of Civil Engineering, Ferdowsi University of Mashhad, Mashhad, Iran
3Department of Civil Engineering, Birjand University of Technology, Iran
*Address for Correspondence: Mohammad Gheibi, Department of Civil Engineering, Ferdowsi University of Mashhad, Mashhad, Iran, Email: [email protected]
Cadmium is naturally present in the mineral cadmium sulfide which is a rare form of this element and the highest amount of cadmium is obtained from the extraction process of other minerals such as lead, copper and zinc. The release of this metal into the environment leads to widespread epidemiological effects. Therefore, measuring small amounts of this metal is also of particular importance. Small amount measuring methods of this metal are such as,preconcentration using solid phase extraction system using adsorbents. The main part of the preconcentration process is achieved by adsorption processes. In this study, the behavior of Freundlich and Langmuir adsorption isotherms for the capacity of TMON and IMNM adsorbents in cadmium adsorption has been evaluated by Power and Rational statistical distributions. At the end of the study, the constant coefficients of the Freundlich and Langmuir models were compared in both linear and non-linear modes. The results showed; the linearization method for the Kf coefficient of the Freundlich isotherm can cause errors equal to 41.6% in TMON adsorbent and 39.3% in IMNM adsorbent. Also, in parameter b, errors of 66.66% are obtained in TMON adsorbent and 32.45% in IMNM adsorbent.
Cadmium is one of toxic heavy metals that enter water sources through different ways such as industrial, domestic, agricultural and unsanitary landfills effluents. Studies show that surface or groundwater in areas near the pollutant sources are contaminated by 0.1 up to 1 mg/l cadmium. This toxic element is storable especially in kidneys and can react with sulfur proteins, causing disorders in the nervous system, pancreas and blood circulation, as well as bone changes and anemia [1]. Cadmium is a soft, malleable, flexible, bluish-white divalent metal that is easy to cut with a knife. It is similar to zinc in many ways, but cadmium forms more complex compounds. The most common oxidation state is cadmium +2, although rare examples of +1 can also be found [2]. It is in group IIB of the periodic table with atomic number 48, an atomic weight of 112.40, and a density of 8.65 Mg/m3. It has also an atomic radius, electro negativity, electrochemical equivalent, electrode potential of 0.154 nm, 1.69, 2.09 g/A/h and -0.403 V respectively. Also at room temperature Cadmium has a hexagonal close packed crystal structure with a = 0.297 nm and c = 0.561 nm and the structure is show in Figure 1.
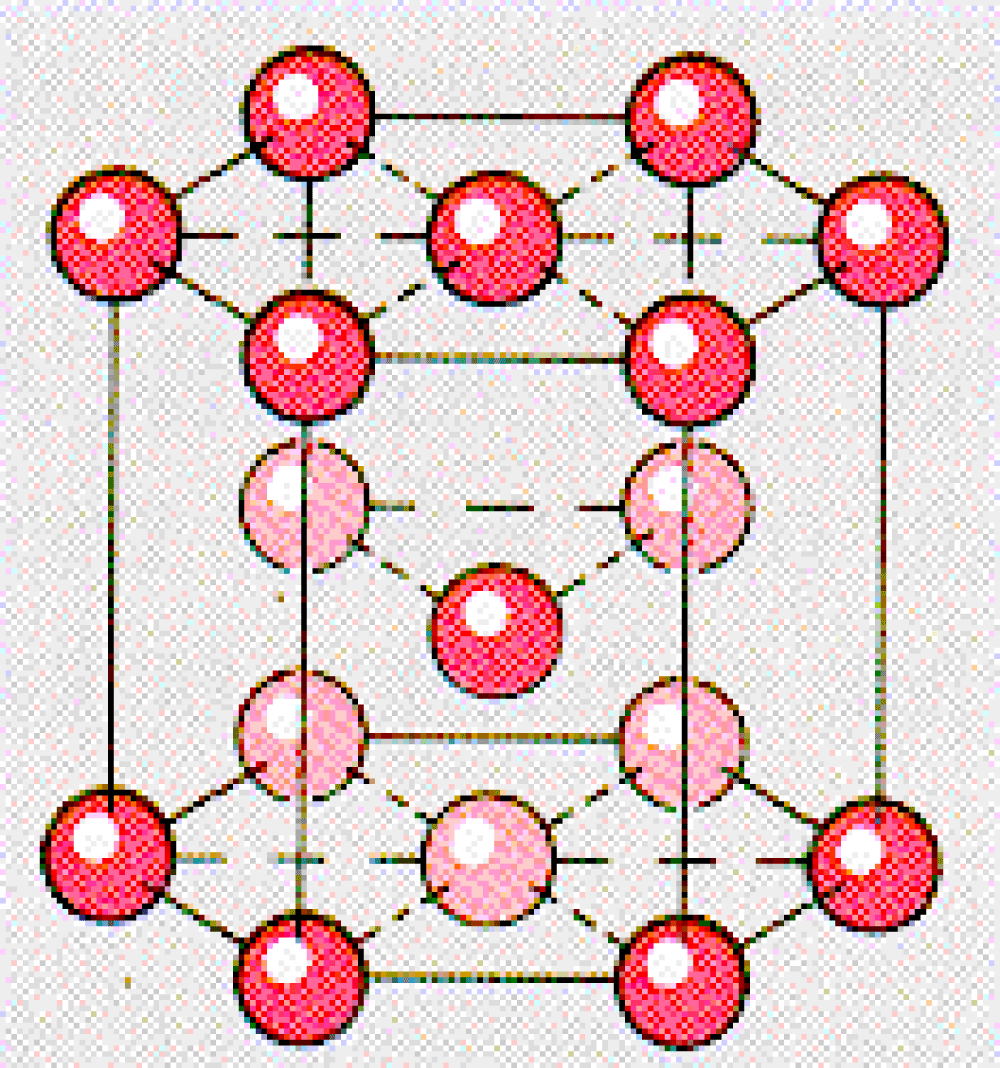
Figure 1: Cadmium molecular structure.
According to the mentioned epidemiological effects, the necessity of measuring small amounts of this metal by methods such as solid phase extraction along with powerful adsorbents becomes obvious. This method was first reported in 1950 for organic analytes in water by trapping them on carbon as an adsorbent and washing with organic solvents. Solid phase extraction is the same as liquid-liquid phase extraction, except that the separating agent in this method is a solid. The use of commercial columns in solid phase mining was introduced in 1970. Since then, this method has grown rapidly and a variety of adsorbents have been used successfully, especially silica gel bonded phases. In addition to extraction, this method is also one of the most widely used methods of sample pre-concentration [3]. The main part of the preconcentration process is achieved by adsorption. Each adsorbent must have two properties including; a high surface-to-volume ratio and a tendency to adsorb adsorbate [4]. The adsorption process has three stages: macroscopic transfer, microscopic transfer and adsorption. The first part of the process involves the movement of the adsorbate in the fluid medium towards the interface between the liquid and solid phases (two-film theory), which takes place through horizontal motion and diffusion. Microscopic transfer is the movement of the adsorbate through the large pores of the adsorbent by partial transfer motions. The final part is the movement of particles towards small (microspores) and very small (sub-microspores) pores. It should be noted that, solid adsorbents, have much number of small pores than medium (mesospores) and large (macrospores) ones, therefore, the physical conditions of the pores determine the removal efficiency in physical treatment [5]. Various isotherms such as the Freundlich and Langmuir isotherms are used to calculate and evaluate the adsorption efficiency. In calculations related to adsorption isotherms, linearization methods have been used, which are always faced with computational errors [6]. This study intends to statistically analyze the adsorption process in the cadmium ion solid phase pre-condensation operation for two different adsorbents and calculate the constant coefficients in the Freundlich and Langmuir Equations by determining the mathematical model of the adsorption capacity relative to equilibrium concentrations.
Solid phase extraction (SPE) is a technique designed for rapid, selective sample preparation and purification, prior to the chromatographic analysis (e.g. HPLC, GC, TLC). In SPE, one or more analytes from a liquid sample are isolated by extracting, partitioning, and/or adsorbing onto a solid stationary phase. Sample preparation by SPE changes the original matrix of a sample to a simpler matrix environment. This renders the sample more suitable for subsequent analytical chromatography, often simplifying and improving the final qualitative and quantitative analysis. The simpler sample matrix also lessons the demand placed on an analytical system, potentially extending the system’s lifetime.
SPE is selective and versatile as many different sorbents and elution conditions are available for different analytes and matrices. Common SPE sorbents include:
• Silica-based
o Reversed phase (C18, C8, cyano, phenyl)
o Normal phase (silica, diol, NH2)
o Ion exchange (SAX, WCX, SCX)
• Carbon-based
• Polymer-based (various compositions, different functionalities)
• Others, for example Florisil® (magnesium silicate) or Alumina
• Mixed-bed: Combinations of nearly any of the above in sequential layers
In ‘Bind‒Elute SPE’, the analyte of interest is captured by the sorbent and the matrix interferences pass through the cartridge. In ‘Interference Removal SPE’, the matrix interferences are captured on the sorbent and the analytes of interest pass through. Both HybridSPE and QuEChERS SPE methods work via Interference Removal. The optimal SPE method depends on the analyte’s structure, solubility, polarity and lipophilic properties (distribution coefficients).
Isotherms of adsorption
One of the adsorption applied models is the Freundlich, which determines the mass of the adsorbate per unit mass of adsorbent (qe). The Freundlich isotherm which is described in Equ. (1) has been obtained through empirical relations [7].
(1)
Kf = Freundlich capacity factor, n-1 = Freundlich power factor, M = Absorbent mass – grams, V = liquid volume in the reactor – Liters
Ce = Equilibrium concentration of adsorbent (mg / l) after operation.
C0 = Equilibrium concentration of adsorbent (mg / l) before operation.
It should be noted that the Freundlich model is a multilayer adsorption type and evaluates the adsorption capacity without limits. In other words, in this model, it is assumed that the adsorbent, besides its surroundings, also performs the adsorption process with less power in the next layers. This is not the case with the Langmuir model, which limits the adsorption process to only the first layer around the adsorbent. The Langmuir model is also expressed in Equ. 2 [7].
(2)
a = experimental coefficient, b= Saturation coefficient – l/gr
Studied adsorbents
In this study, the behavior of two adsorbents including Fe-Al-Zr Ternary Mixed Oxides Nano composite (TMON) [8] and Iron Magnetite Nanoparticles Modified by SDS and 2-mercaptobenzothiazole (IMNM) [9] in the cadmium pretreatment process by solid phase separation was evaluated. It should also be noted that all statistical analyzes were performed by the CFTool of MATLAB 2013b software. Adsorption curves for adsorbed Nano composite (TMON) and modified magnetic iron nanoparticles (IMNM) are shown in Figures 2 and 3, respectively.
The data in Figures were extracted by [X-Y] Extraction software and then all statistical analyzes were performed on this data.
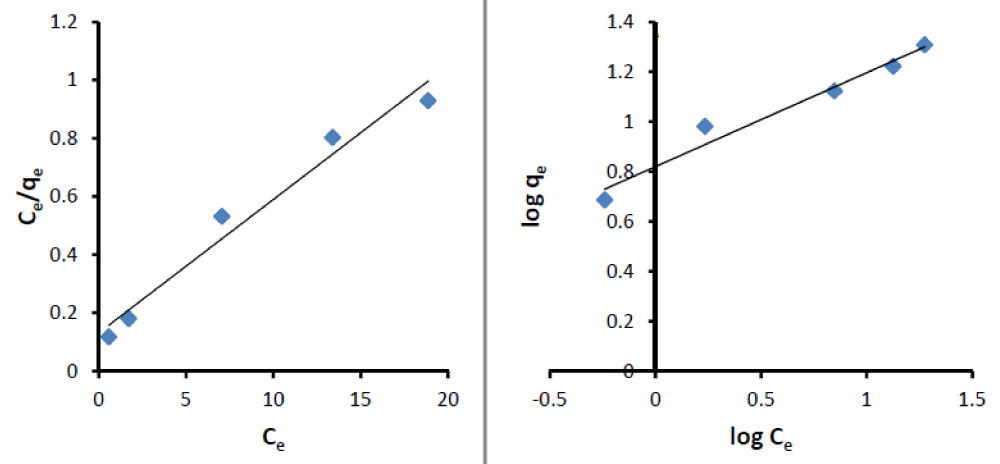
Figure 2: Freundlich and Langmuir isotherms Diagram in the solid phase extraction process of cadmium ion by TMON adsorbent.
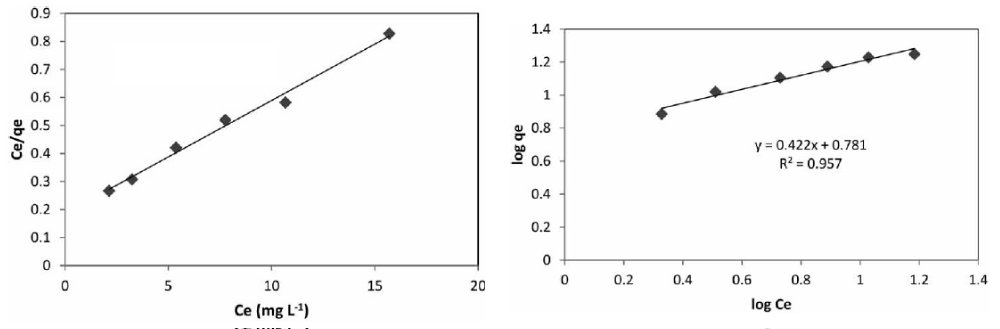
Figure 3: Freundlich and Langmuir isotherms Diagram in the solid phase extraction process of cadmium ion by IMNM adsorbent.
After data mining of the above graphs, the adsorption capacity of each of the TMON and IMNM adsorbents was calculated, which can be seen in Figures 4 and 5.
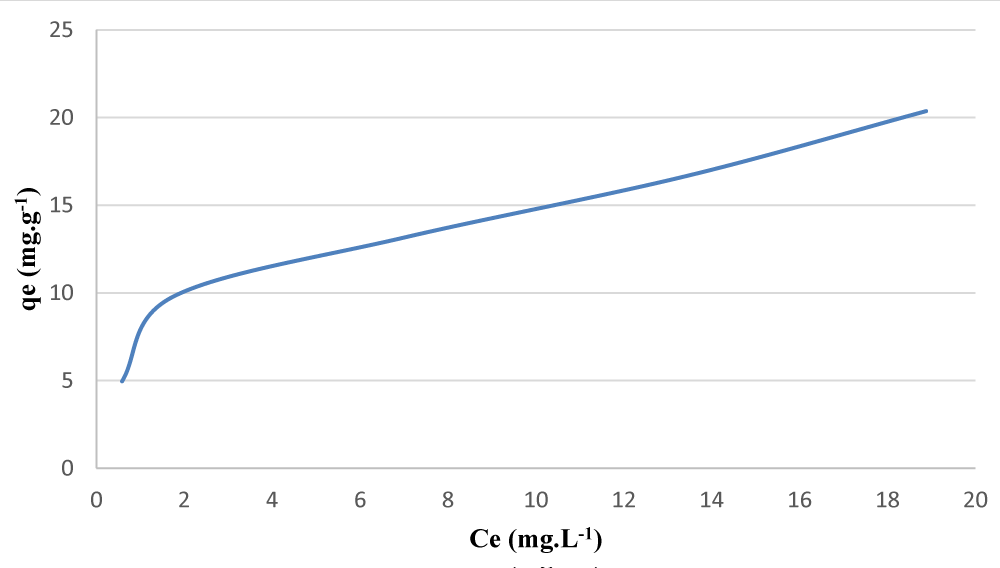
Figure 4: Adsorption capacity Diagram in the solid phase extraction process of cadmium ion by TMON adsorbent.
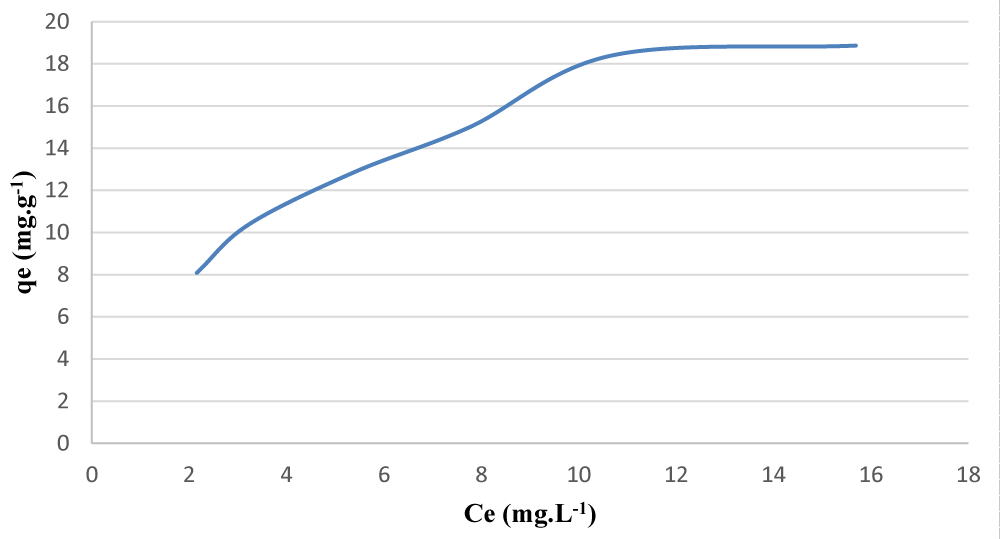
Figure 5: Adsorption capacity Diagram in the solid phase extraction process of cadmium ion by IMNM adsorbent.
Mathematically, the Freundlich Equation is similar to the power distribution ( ) and the Langmuir is alike to the rational distribution ( ). Therefore, the above two distributions are simulated for both adsorbents and the results are summarized in Table 1. After calculating the above distributions by equating the mathematical distributions with the adsorption isotherms, the coefficients ‘Kf’ and ‘n’ in the Freundlich and ‘a’ and ‘b’ in the Langmuir model were obtained.
| Table 1: Rational and Power statistical distributions to determine the adsorption parameters of TMON and IMNM adsorbents | ||||||||
| Adsorbent | Rational distribution | R2 | SSE | RMSE | A | B | C | D |
| TMON | f(x) = (A*x + D) / (Bx + C) | 0.9564 | 6.214 | 1.763 | 31.2 | 1 | 15.03 | 79.14 |
| IMNM | f(x) = (A*x + D) / (Bx + C) | 0.9548 | 4.210 | 1.185 | 26.39 | 1 | 0.085 | -4.19 |
| adsorbent | Power distribution | R2 | SSE | RMSE | A | B | ||
| TMON | f(x) = A*x^B | 0.9727 | 3.89 | 1.14 | 6.88 | 0.3568 | ||
| IMNM | f(x) = A*x^B | 0.9801 | 10 | 1.58 | 22.95 | 0.6680 | ||
The results of the constant coefficients in the Freundlich and Langmuir models for both linear and nonlinear manners are presented in Tables 2 and 3, respectively.
| Table 2: Values of constant coefficients in the Freundlich isotherm for linear and nonlinear states. | ||||||
| Adsorbent | Kf (linear) | Kf(nonlinear) | Error % | n(linear) | n(nonlinear) | Error % |
| TMON | 2.27 | 3.89 | 41.6% | 2.65 | 2.80 | 5.35% |
| IMNM | 6.07 | 10 | 39.3% | 2.39 | 1.49 | 60.4% |
Table 3: Values of constant coefficients in the Langmuir isotherm for linear and nonlinear states. |
||||||
| Adsorbent | a(linear) | a(nonlinear) | Error % | b(linear) | b(nonlinear) | Error % |
| TMON | 21.83 | 30.57 | 28.59% | 0.34 | 1.02 | 66.66% |
| IMNM | 24.80 | 28.95 | 14.33% | 4.62 | 6.84 | 32.45% |
As shown in Table 2; the mass transfer coefficient Kf in linear mode for TMON and IMNM adsorbents has errors of 41.6% and 39.3%, respectively. For the Freundlich power factor (n), the errors are 5.35% for the TMON and 60.4% for the IMNM adsorbent. These results indicate that the linearization error is considerable and severely overshadows the final results. Also, the Langmuir adsorption model for the constant parameter n has an error percentage of 28.59% in the TMON and 14.33% in the IMNM adsorbent. However, it should be noted that the maximum absorption parameter (b) is very important and the inferred errors make the laboratory data interpretation more difficult. Evaluations showed; this parameter has a 66.66% error for TMON and 32.45% for IMNM adsorbent. Therefore, the results of this study highlight the difference between the results of linear and nonlinear methods and emphasize the need to use nonlinear ones.
Cadmium is one of the metals able to cause severe environmental damages. This divalent metal is released into the environment due to industrial and mining activities. Therefore, many industries are looking for methods to identify small amounts of this metal in water, soil and air resources. One of the common methods is pre-concentration and measurement of small amounts of cadmium in the solid phase extraction system. The key part of the pre-concentration process is solid phase extraction by adsorption operations using different adsorbents. Therefore, most studies seek to use powerful adsorbents and calculate the amount of adsorption capacity by models such as the Freundlich isotherm or Langmuir. This study first selected the two adsorbents TMON and IMNM for the case study then modeled the power and rational statistical distributions of the absorption capacity and equilibrium concentration. In the final step, the constant coefficients of the Freundlich and Langmuir isotherms are met by nonlinear distributions and compared with the results of linearization. The results showed; the linearization method for the Kf coefficient of the Freundlich isotherm can cause errors of 41.6% in the TMON and 39.3% in the IMNM adsorbent. Also in parameter b, errors equal to 66.66% are obtained for TMON and 32.45% for IMNM adsorbent.
- Kjellström T. Mechanism and epidemiology of bone effects of cadmium. IARC Sci Publ. 1991; 301-310. PubMed: https://pubmed.ncbi.nlm.nih.gov/1303956/
- Friberg L, Piscator M, Nordberg GF, Kjellström T. Cadmium in the Environment (No. 2nd edition). 1974.
- Fang GZ, Tan J, Yan XP. An ion-imprinted functionalized silica gel sorbent prepared by a surface imprinting technique combined with a sol− gel process for selective solid-phase extraction of cadmium (II). Anal Chem. 2005; 77: 1734-1739. PubMed: https://pubmed.ncbi.nlm.nih.gov/15762579/
- Gregg SJ, Sing KSW, Salzberg HW. Adsorption surface area and porosity. J Electrochem Soc. 1967: 114: 279C-279C.
- Bradl HB. Adsorption of heavy metal ions on soils and soils constituents. J Colloid Interface Sci. 2004; 277: 1-18. PubMed: https://pubmed.ncbi.nlm.nih.gov/15276031/
- Fu F, Wang Q. Removal of heavy metal ions from wastewaters: a review. J Environ Manage. 2011; 92: 407-418. PubMed: https://pubmed.ncbi.nlm.nih.gov/21138785/
- Foo KY, Hameed BH. Insights into the modeling of adsorption isotherm systems. Che Eng J. 2010; 156: 2-10.
- Bayisa KC. Chelating Agent Free Solid Phase Extraction (CAF–SPE) of Lead, Cadmium and Chromium by Fe-Al-Zr Ternary Mixed Oxides Nanocomposite. Thesis Submitted to the Department of Chemistry, Postgraduate Program Directorate, Haramaya University.
- Abbasi S, ShanbehDehbalai M, Khani H. Solid phase extraction of trace amounts of cadmium (II) ions in water and food samples using iron magnetite nanoparticles modified by sodium dodecyl sulfate and 2-mercaptobenzothiazole. Water Sci Technol. 2017; 75: 1440-1446. PubMed: https://pubmed.ncbi.nlm.nih.gov/28333059/