
More Information
Submitted: 15 May 2020 | Approved: 26 May 2020 | Published: 27 May 2020
How to cite this article: Nwankwoala HO, Amadi AN, Omofuophu E, Ibrahim HA. Risk evaluation and modeling of soils contaminated with Polycyclic Aromatic Hydrocarbons (PAHs) in parts of Bonny Island, Niger Delta, Nigeria. Ann Civil Environ Eng. 2020; 4: 015-026.
DOI: 10.29328/journal.acee.1001021
Copyright License: © 2020 Nwankwoala HO, et al. This is an open access article distributed under the Creative Commons Attribution License, which permits unrestricted use, distribution, and reproduction in any medium, provided the original work is properly cited.
Keywords: Risk assessment; Soils; Hydrocarbons; Oil spill; Contaminants; Bonny island; Niger delta

Risk evaluation and modeling of soils contaminated with Polycyclic Aromatic Hydrocarbons (PAHs) in parts of Bonny Island, Niger Delta, Nigeria
Nwankwoala HO1*, Amadi AN2, Omofuophu E1 and Ibrahim HA3
1Department of Geology, University of Port Harcourt, Nigeria
2Department of Geology, Federal University of Technology, Minna, Niger State, Nigeria
3Department of Geology, Usmanu Danfodiyo University, Sokoto, Nigeria
*Address for Correspondence: Nwankwoala HO, Department of Geology, University of Port Harcourt, Nigeria, Tel: +234 (0) 803 672 3009; +234 (0) 705 528 5704; Email: [email protected]
Environmental impact of a recent oil spill incident in Bonny terminal using soil media was studied using a risk-based modeling approach. The establishment of the presence of contaminants of concern (CoC), evaluation/assessment, modeling spilled volume and ascertaining potential health risk associated with the spill incident was carried out. The Contaminant of Concern (CoC) included Total Petroleum Hydrocarbons (TPH) and Polycyclic Aromatic Hydrocarbons (PAHs). Soils and groundwater were sampled in the vicinity of the spill incident and further away into the surrounding communities. Soils were sampled into the depths (0.1 m, 0.5 m,1.0 m, 1.5 m), and the results of sieve analysis revealed that the area is predominantly silty sand in composition. This study also revealed that TPH concentration at all locations and depths exceeded DPR target value of 50 mg/kg. The TPH model revealed that a total volume of 222,500m3 of the spill area exceeded DPR intervention value of 5000 mg/kg. The results of PAH showed that only BS-1, BS-6, BS-8, BS-9 and BS-10 exceeded DPR target value of 1.0 mg/kg at some depths. All other sample depths and locations were within the target limit. The 3-D grid generated for PAH showed that 563,000m3 of the study area exceeded the DPR target value. The 3-D block models generated for TPH and PAH, along with the cross-sections and extracted time slices all showed that the concentration of the Contaminant of Concern (CoC) generally decreased with depth, and the centre of the spill located at the south-eastern part of the survey area. Based on these models, three spill zones were identified; Zone 1-highly contaminated areas (BS-8, BS-9, BS-10); Zone 2 - moderately contaminated areas (BS-1, BS-2, BS-6, BS-7); and low contaminated areas (BS-3, BS-4, BS-5). The entire soil in the area were contaminated with TPH and 47% of the area contaminated with PAH. This study has shown the effectiveness of the use of a model-based approach in quantifying hydrocarbon contamination volumes in the area. There is therefore the need for continuous monitoring of hydrocarbon spills in the area.
Crude oil exploration is a major economic venture in Nigeria which [1,2] noted has resulted to the release of polycyclic aromatic hydrocarbons and heavy metals into soils and water bodies through oil spillage. In soils, petroleum hydrocarbon creates conditions which lead to unavailability of essential nutrients to plants [3]. It implies that the soil remains unsuitable until the crude oil is degraded to a tolerable level. The amount of natural crude oil seepage was estimated to be 600,000 metric tons per year with a range of uncertainty of 200,000 metric tons per year [4,5]. The discharge of crude oil whether accidentally or due to human activities is a main cause of water and soil pollution and they constitute a serious environmental problem which can threaten human health and that of beneficial organisms in the environment [1].
Cocarta, et al. [6] used a risk assessment approach in the studies of soils in crude oil contaminated sites in Romania. Their study revealed the operating mode and utility of environmental software (RECOLAND v1.0) which was able to integrate dose-response modeling as a major part of hazard quotient characterization in order to assess the quantitative carcinogenic risk. This risk assessment method was then used for the investigation of contaminated sites. The contaminants of concern (CoC) considered in their research were monocyclic aromatic hydrocarbons, polycyclic aromatic hydrocarbons and heavy metals. These contaminants are some of the well-known human carcinogens. Their study revealed an individual risk of 1.07 x 10⁻⁵ for children and 6.89 x 10⁻⁶ for adults. These results exceeded the acceptable risk value recommended by the WHO (1 x 10⁻⁶) which suggests that oil contamination in soil is a significant contributor to the higher level of risk in the area.
Risk-based evaluation/assessment has been internationally recognized as the best most cost-effective scientific tool for contaminated sites remediation [6-8]. For the assessment of environmental risks associated with soil and groundwater contamination with petroleum hydrocarbons, it is important to evaluate the sources, the spatial distribution and pathways of total petroleum hydrocarbons in soils and groundwater. Risk assessment study involves detailed site characterization, human and ecological risk quantification, and finally selection of remedial strategies [9]. If the levels of contamination after the risk assessment were unacceptable, remedial action must be selected and implemented to achieve the remedial aims in an efficient and cost effective manner. This study therefore utilizes a risk-based approach in the evaluation of soils around an oil spill sites in Bonny, Rivers State, Nigeria.
Oil spills are common environmental issues prevalent in the Niger Delta region of Nigeria. These spills could occur in a number of ways, including; drilling operations, production operations, transportation of crude oil and also from storage facilities. A major cause of oil spill in the Delta arises from pipeline vandalisation and illegal bunkering activities [10]. Oil spills on the environment eventually leads to soil and groundwater contamination, with a huge deleterious effect on plants, human health and wildlife [11,12]. In Bonny area, there was a spill incident that occurred from a multinational oil company’s facility during the first quarter of 2017. Hence, the use of a model based approach in quantifying hydrocarbon contamination volumes in the spilled area in Bonny Island, Niger Delta, Nigeria.
Location and accessibility
The study area, Ubani and its environs is located in Bonny Island within latitudes 4ᵒ25’ 00”N and 4º26’ 40”N and longitudes 7º09’ 20”E and 7º12’ 00”E (Figure 1). The North and Western part of the study area is bounded by Bonny River, to the South of the area by Bonny oil and gas terminal owned and operated by a multinational Oil Company, while to the East of the area is the Federal Polytechnic of oil and gas, Bonny. Several swamps and creeks are predominant within the study area. The study area is accessible through Bonny River and other tarred roads in the area.
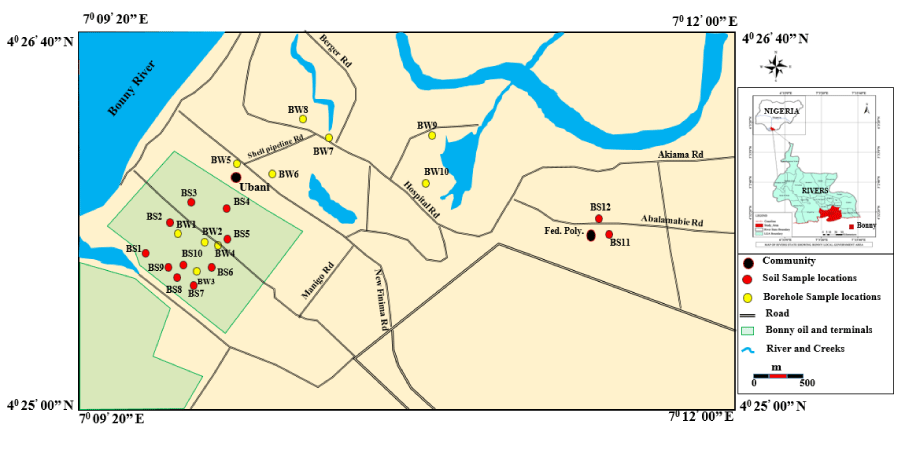
Figure 1: Depicting the centers of gravity of the links.
Soil sampling
Soil samples were collected randomly within the study area. Eight (8) soil samples were collected within the spill sites, two (2) samples were obtained from Ubani, about 500m North of the spill area, while two (2) samples were obtained 2km away from the spill site. A total of twelve (12) soil samples were obtained from the research area (Table 1). Soil sampling was done with the aid of a hand auger and samples were collected at 0.1 m, 0.5 m, 1.0 m and 1.5 m depth respectively at each location. The auger was carefully washed after sampling each depth before a deeper depth was sampled to prevent contamination of the samples. At each depth, the samples were carefully described with respect to soil colour, smell and hydrocarbon sheen. Over 1kg of soil samples were collected at each depth and carefully packed in clean polythene bags. The samples were eventually transported to the laboratory for chemical analysis (TPH, PAH). All sampling locations were determined and recorded with the aid of a Garmin GPS.
| Table 1: Standard laboratory procedures and methods for analysis of petroleum compounds. | |||
| Chemical compound | Unit | Laboratory standard | Method |
| TPH | mg/kg | USEPA 8015 | Gas Chromatography with flame ionisation detector |
| PAH | Gas Chromatography-Mass spectrometer |
||
| Naphthalene | mg/kg | USEPA 8270 | |
| Acenaphthylene | mg/kg | USEPA 8270 | |
| Acenaphthene | mg/kg | USEPA 8270 | |
| Fluorene | mg/kg | USEPA 8270 | |
| Anthracene | mg/kg | USEPA 8270 | |
| Phenanthrene | mg/kg | USEPA 8270 | |
| Fluoranthene | mg/kg | USEPA 8270 | |
| Pyrene | mg/kg | USEPA 8270 | |
| Benzo (a) anthracene | mg/kg | USEPA 8270 | |
| Chrysene | mg/kg | USEPA 8270 | |
| Benzo (b) fluoranthene | mg/kg | USEPA 8270 | |
| Benzo (k) fluoranthene | mg/kg | USEPA 8270 | |
| Benzo (a) pyrene | mg/kg | USEPA 8270 | |
| Dibenz(a,h)anthracene | mg/kg | USEPA 8270 | |
| Indeno(1,2,3-cd)pyrene | mg/kg | USEPA 8270 | |
| Benzo (g,h,i) perylene | mg/kg | USEPA 8270 | |
Laboratory analysis
The soil and groundwater samples were analyzed for the following pollutants of concern in oil spill sites; Total Petroleum Hydrocarbons (TPH) and Polycyclic Aromatic Hydrocarbons (PAHs) due to their toxic properties and negative effects on human health.
Determination of Total Petroleum Hydrocarbon (TPH)
Method: Gas Chromatography with flame ionisation detector (GC – FID) [13].
Apparatus:
I. GC – FID
II. Satarious weighing balance
III. Funnel
IV. Filter paper
V. Rotary evapourator
VI. Vials bottle
Reagents:
I. Dichloro methane
II. N-Hexane
III. Alkane mix (C10 –C40 standard)
Digestion for TPH determination: The soil sample was air dried, crushed and sieved using a 2 mm mesh. Afterwards, 5 g of the sieved soil sample was placed in a thimble and extracted with 20 ml of Dichloromethane in a soxhlet extractor for 6h. The extract was concentrated with a rota evaporator to 2 ml and stored in a glass vial. Another 5 g of the sieved soil sample was placed in a thimble and extracted with 20mls of Hexane in a soxhlet extractor for 6 hours. The extract was concentrated with a rota evaporator to 2ml and stored in a glass vial awaiting analysis [13-15].
Procedures
Silica gel (200-400) mesh was heated at 105 0C overnight and packed into a glass column (600 mm x 30 mm) with I.D (10 mm). 5 g of the soil sample was introduced into the glass column, followed by the solvents. The aliphatic hydrocarbons were eluted with 60 ml of Hexane, while the aromatic hydrocarbon was eluted with 40 ml of Dichloromethane. The effluents were concentrated to 2ml and transferred to a glass sample for gas chromatography.
The Gas Chromatography was carried out with a Buck Scientific GC (model 910) fitted with split/splitless injector. The column used for the separation was a fused- silica capillary column, (30 mm x 0.2 5 mm). The GC was equipped with a flame ionization detector. The gas carrier was helium. The oven temperature was programmed from 50 0C - 300 0C at 5 0C/min. The hold time was 5 min at 50 0C and 30 min at 300 0C. IµL of the Alkane mix was injected into the GC to obtain the standard chromatograph. IµL of the concentrated DCM and N- Hexane extract was then injected into the GC for the TPH analysis [13].
Determination of Polycyclic Aromatic Hydrocarbons (PAH)
Preparation of PAH: A commercial standard containing 16 PAHs mixture (stock solution 10 ng/L) was used to prepare calibration graphs. Calibration standard of concentration ranging between 0.01 and 5.00 ng/L of the 16 PAHs standards were analyzed by GC-MS [13]. The prepared mixture solution was injected in triplicate onto the column. For the internal standard, thirty-seven (37 μL) of tridecane was measured and mixed with 1mL of dichloromethane (DCM). 1 μL of the mixture was injected in triplicate into the GC-MS and analyzed [16].
Extraction of PAH: Extraction was carried out by liquid-liquid extraction method (USEPA, 1994). Water samples were mixed with phosphate buffer (pH 6.8) to stop any micro-organic process. The samples were passed through glass wool to remove sediments and coagulations. 100 mL of the sample was measured with a volumetric flask and extracted with 20 mL of dichloromethane (DCM) in a separatory funnel. The mixture was shaken for 2 minutes and allowed to separate for 5 minutes. The bottom layer was decanted into a pre-cleaned and labeled flask and wrapped in foil. This step was repeated twice per sample.
Sample Clean-Up: The extract was then passed through slurry packed with silica gel, followed by aluminum oxide and anhydrous sodium sulfate. The column was washed with 15 ml of hexane and the PAHs were collected by eluting the column with 100 ml of hexane and 100 ml of dichloromethane. The eluate was then concentrated to about 3 ml using a rotary evaporator which was further reduced to about 0.5 ml using a stream of gaseous nitrogen. This helped volatize the solvent thereby concentrating the PAHs. At this stage all water samples were ready for injection into the GC-MS for analysis.
Identification and quantification of PAH
Identification of PAHs in the samples was confirmed by the retention time and abundance of quantification/confirmation ions and mass spectra match against the calibration standards in the authentic PAHs standards. Confirmation of identity of the analytes was done using NIST/EPA/NIH Mass Spectral Library (NIST 05) and NIST Mass Spectral Search Program Version 2.0d. Quantification of individual PAH compounds was performed by the method of internal standardization. The quantitation was based on the ratio of the peak height of the quant ion to that of the internal standard. The possibility of selected ion chromatogram enabled us to detect the target ion without ambiguity, despite the complexity of the samples [17].
Total petroleum hydrocarbons in soil
The results of Total Petroleum Hydrocarbons (TPHs) in soils are presented in table 2 and summarized in table 3. Figure 3 shows the variations in TPH concentrations with depth along with DPR (1991) target and intervention values. The soil TPH around the contaminated site ranges from 99 to 30784 mg/kg with a mean and standard deviation (SD) of 7964 ± 11797 mg/kg at 0.1m depth. The highest TPH concentration is obtained from BS-9 while the lowest is obtained from BS-3. The huge SD value is indicative of a wide variability existing amongst the TPH results (Table 3). At the control site, the TPH value is 19.78 mg/kg for 0.1m depth. Apart from the control site, TPH at all other sample location within the spill area exceeded DPR (1991) target value of 50 mg/kg (Figure 3). Also BS-8, BS-9 and BS-10 exceeded DPR intervention value of 5000 mg/kg. This shows that the soils at these depths are not only contaminated but needs immediate remediation attention. Average concentration of TPH at 0.1m depth exceeded those of the control site and both DPR target and Intervention values (Figure 2).
| Table 2: Results of soil chemical analysis and soil composition in the study area. | ||||||||||||||||||||
Sample ID |
BS-1 |
BS-2 |
BS-3 |
BS-4 |
||||||||||||||||
| Depth (m) | 0.10 | 0.50 | 1.00 | 1.50 | 0.10 | 0.50 | 1.00 | 1.50 | 0.10 | 0.50 | 1.00 | 1.50 | 0.10 | 0.50 | 1.00 | 1.50 | 2.00 | |||
| TPH, mg/kg | 682.95 | 930.00 | 970.30 | 1120.40 | 230.20 | 200.32 | 180.00 | 298.00 | 99.00 | 98.81 | 99.13 | 87.00 | 531.80 | 254.38 | 118.56 | 1004.00 | 136.37 | |||
| PAH, mg/kg | ||||||||||||||||||||
| Naphthalene | 0.20 | 0.07 | 0.03 | <0.01 | 0.06 | 0.01 | <0.01 | <0.01 | 0.01 | <0.01 | <0.01 | <0.01 | 0.01 | <0.01 | <0.01 | 0.01 | <0.01 | |||
| Acenaphthylene | 0.20 | 0.04 | 0.03 | <0.01 | 0.08 | 0.06 | <0.01 | 0.02 | <0.01 | <0.01 | <0.01 | <0.01 | <0.01 | <0.01 | <0.01 | 0.02 | <0.01 | |||
| Acenaphthene | 0.31 | 0.08 | 0.05 | <0.01 | 0.13 | <0.01 | <0.01 | <0.01 | <0.01 | <0.01 | <0.01 | <0.01 | <0.01 | <0.01 | <0.01 | <0.01 | <0.01 | |||
| Fluorene | 0.02 | 0.12 | 0.08 | <0.01 | <0.01 | 0.02 | <0.01 | 0.01 | 0.02 | <0.01 | <0.01 | <0.01 | <0.01 | <0.01 | <0.01 | 0.01 | <0.01 | |||
| Anthracene | 0.16 | 0.24 | 0.16 | <0.01 | <0.01 | 0.04 | <0.01 | 0.02 | <0.01 | <0.01 | <0.01 | <0.01 | 0.01 | 0.01 | <0.01 | 0.03 | 0.01 | |||
| Phenanthrene | 0.25 | 0.01 | 0.01 | <0.01 | 0.04 | <0.01 | <0.01 | 0.01 | <0.01 | <0.01 | <0.01 | <0.01 | <0.01 | <0.01 | <0.01 | 0.01 | 0.01 | |||
| Fluoranthene | 0.21 | 0.03 | 0.02 | <0.01 | 0.13 | <0.01 | <0.01 | 0.02 | <0.01 | <0.01 | <0.01 | <0.01 | <0.01 | 0.02 | <0.01 | 0.01 | <0.01 | |||
| Pyrene | 0.05 | 0.04 | 0.02 | <0.01 | 0.12 | <0.01 | <0.01 | 0.03 | 0.01 | 0.01 | <0.01 | 0.01 | <0.01 | <0.01 | <0.01 | 0.03 | <0.01 | |||
| Benzo (a) anthracene | 0.20 | 0.03 | 0.02 | <0.01 | <0.01 | <0.01 | <0.01 | 0.03 | <0.01 | <0.01 | <0.01 | <0.01 | <0.01 | <0.01 | <0.01 | 0.02 | <0.01 | |||
| Chrysene | 0.18 | 0.07 | 0.04 | <0.01 | <0.01 | <0.01 | <0.01 | 0.05 | <0.01 | 0.01 | <0.01 | <0.01 | <0.01 | <0.01 | <0.01 | 0.04 | <0.01 | |||
| Benzo (b) fluoranthene | 0.03 | 0.03 | 0.01 | <0.01 | <0.01 | <0.01 | <0.01 | 0.01 | <0.01 | <0.01 | <0.01 | <0.01 | <0.01 | <0.01 | <0.01 | <0.01 | <0.01 | |||
| Benzo (k) fluoranthene | 0.03 | 0.02 | 0.01 | <0.01 | 0.09 | <0.01 | <0.01 | 0.01 | 0.01 | 0.01 | <0.01 | <0.01 | <0.01 | <0.01 | <0.01 | <0.01 | <0.01 | |||
| Benzo (a) pyrene | 0.10 | 0.02 | 0.02 | <0.01 | 0.08 | <0.01 | <0.01 | 0.02 | <0.01 | 0.01 | 0.01 | <0.01 | <0.01 | <0.01 | <0.01 | <0.01 | <0.01 | |||
| Dibenz(a,h)anthracene | 0.01 | 0.02 | 0.01 | <0.01 | 0.02 | 0.01 | <0.01 | 0.01 | 0.01 | 0.02 | 0.01 | 0.01 | <0.01 | <0.01 | 0.01 | 0.01 | <0.01 | |||
| Indeno(1,2,3-cd)pyrene | 0.02 | 0.01 | <0.01 | <0.01 | <0.01 | <0.01 | <0.01 | <0.01 | 0.02 | <0.01 | <0.01 | <0.01 | <0.01 | <0.01 | <0.01 | <0.01 | <0.01 | |||
| Benzo (g,h,i) perylene | 0.01 | 0.03 | 0.01 | 0.01 | 0.05 | 0.03 | 0.04 | 0.01 | 0.04 | <0.01 | 0.01 | <0.01 | <0.01 | 0.04 | 0.01 | 0.01 | <0.01 | |||
| Total | 1.98 | 0.86 | 0.52 | 0.01 | 0.80 | 0.17 | 0.04 | 0.25 | 0.12 | 0.06 | 0.03 | 0.02 | 0.02 | 0.07 | 0.02 | 0.20 | 0.02 | |||
Sample ID |
BS-5 |
BS-6 |
BS-7 |
BS-8 |
|||||||||||
| Depth (m) | 0.10 | 0.50 | 1.00 | 1.50 | 0.10 | 0.50 | 1.00 | 0.10 | 0.50 | 1.00 | 1.50 | 0.10 | 0.50 | 1.00 | 1.50 |
| TPH, mg/kg | 610.00 | 213.26 | 156.00 | 74.98 | 390.00 | 410.00 | 526.00 | 3432.00 | 1477.00 | 395.44 | 245.87 | 19615.00 | 677.84 | 1178.00 | 320.64 |
| PAH, mg/kg | |||||||||||||||
| Naphthalene | 0.01 | <0.01 | <0.01 | <0.01 | <0.01 | 0.03 | 0.01 | 0.18 | <0.01 | <0.01 | <0.01 | 0.03 | <0.01 | <0.01 | <0.01 |
| Acenaphthylene | <0.01 | <0.01 | <0.01 | <0.01 | <0.01 | 0.02 | 0.01 | 0.17 | 0.04 | <0.01 | <0.01 | 12.38 | 0.02 | 0.02 | 0.01 |
| Acenaphthene | 0.01 | <0.01 | <0.01 | <0.01 | <0.01 | 0.08 | 0.01 | 0.32 | 0.01 | <0.01 | <0.01 | 1.24 | 0.01 | <0.01 | <0.01 |
| Fluorene | 0.02 | <0.01 | <0.01 | <0.01 | 0.01 | 0.06 | 0.01 | 0.17 | 0.11 | 0.01 | 0.01 | 2.94 | 0.19 | 0.06 | 0.02 |
| Anthracene | <0.01 | 0.01 | <0.01 | <0.01 | 0.09 | 0.09 | 0.12 | 0.54 | 0.12 | 0.01 | 0.02 | 3.86 | 0.05 | 0.04 | 0.02 |
| Phenanthrene | <0.01 | <0.01 | <0.01 | <0.01 | 0.01 | 0.02 | 0.03 | 0.15 | 0.09 | 0.05 | 0.03 | 3.9 | 0.02 | 0.07 | 0.01 |
| Fluoranthene | <0.01 | <0.01 | <0.01 | <0.01 | 0.06 | 0.12 | 0.15 | 1.9 | 0.06 | 0.02 | 0.05 | 0.41 | 0.02 | 0.06 | 0.01 |
| Pyrene | <0.01 | <0.01 | <0.01 | <0.01 | 0.04 | 0.16 | 0.08 | 1.87 | 0.01 | <0.01 | <0.01 | 0.17 | 0.01 | <0.01 | 0.01 |
| Benzo (a) anthracene | <0.01 | <0.01 | <0.01 | <0.01 | 0.02 | 0.09 | 0.12 | 1.32 | 0.02 | 0.01 | 0.01 | 1.31 | 0.05 | 0.13 | 0.01 |
| Chrysene | <0.01 | <0.01 | <0.01 | <0.01 | 0.03 | 0.11 | 0.13 | 1.1 | 0.03 | 0.01 | 0.01 | 1.65 | 0.02 | 0.02 | 0.02 |
| Benzo (b) fluoranthene | <0.01 | <0.01 | <0.01 | <0.01 | 0.05 | 0.11 | 0.15 | 0.54 | 0.1 | 0.01 | 0.01 | 0.32 | 0.02 | 0.03 | 0.01 |
| Benzo (k) fluoranthene | <0.01 | <0.01 | <0.01 | <0.01 | 0.04 | 0.13 | 0.12 | 1.08 | 0.11 | 0.02 | 0.01 | 0.04 | 0.04 | 0.01 | 0.01 |
| Benzo (a) pyrene | <0.01 | 0.01 | <0.01 | 0.01 | 0.03 | 0.09 | 0.07 | 0.64 | 0.02 | 0.01 | 0.01 | 0.06 | 0.03 | 0.04 | 0.01 |
| Dibenz(a,h)anthracene | <0.01 | 0.01 | <0.01 | <0.01 | 0.01 | 0.1 | 0.06 | 0.44 | 0.02 | 0.02 | 0.03 | 0.02 | 0.04 | 0.02 | 0.02 |
| Indeno(1,2,3-cd)pyrene | <0.01 | <0.01 | 0.01 | <0.01 | 0.02 | 0.02 | 0.02 | 0.15 | 0.02 | 0.02 | 0.04 | 0.09 | 0.02 | 0.05 | 0.03 |
| Benzo (g,h,i) perylene | 0.08 | 0.01 | <0.01 | 0.01 | 0.01 | 0.1 | 0.05 | 0.23 | 0.06 | 0.03 | 0.05 | 0.07 | 0.03 | 0.03 | 0.02 |
| Total | 0.12 | 0.04 | 0.01 | 0.02 | 0.42 | 1.33 | 1.14 | 10.8 | 0.82 | 0.22 | 0.28 | 28.49 | 0.57 | 0.58 | 0.21 |
Sample ID |
BS-9 |
BS-10 |
BS-11 |
BS-12 |
||||||||||||
| Depth (m) | 0.10 | 0.50 | 1.00 | 1.50 | 0.10 | 0.50 | 1.00 | 1.50 | 0.10 | 0.50 | 1.00 | 1.50 | 0.10 | 0.50 | 1.00 | 1.50 |
| TPH, mg/kg | 30784.00 | 19512.00 | 15421.00 | 1258.00 | 23262.00 | 18486.00 | 18873.00 | 1516.00 | 20.00 | 29.43 | 12.32 | 18.00 | 19.56 | 18.33 | 23.00 | 31.00 |
| PAH, mg/kg | ||||||||||||||||
| Naphthalene | <0.01 | 0.02 | 0.02 | <0.01 | 0.22 | 0.11 | 0.07 | <0.01 | <0.01 | <0.01 | <0.01 | <0.01 | <0.01 | <0.01 | <0.01 | <0.01 |
| Acenaphthylene | 10.97 | 7.81 | 9.43 | 0.06 | 9.69 | 5.26 | 5.55 | 0.04 | <0.01 | <0.01 | <0.01 | <0.01 | <0.01 | <0.01 | <0.01 | <0.01 |
| Acenaphthene | 1.04 | 0.32 | 0.95 | 0.01 | 0.9 | 0.4 | 0.08 | <0.01 | <0.01 | <0.01 | <0.01 | <0.01 | <0.01 | <0.01 | <0.01 | <0.01 |
| Fluorene | 2.02 | 2.18 | 1.08 | 0.07 | 2.07 | 0.44 | 1.5 | 0.05 | <0.01 | <0.01 | <0.01 | <0.01 | 0.02 | <0.01 | <0.01 | <0.01 |
| Anthracene | 0.85 | 0.4 | 0.82 | 0.23 | 0.69 | 1.16 | 0.3 | 0.02 | <0.01 | <0.01 | <0.01 | <0.01 | <0.01 | <0.01 | <0.01 | <0.01 |
| Phenanthrene | 1.87 | 1.66 | 1 | 0.02 | 0.65 | 0.21 | 0.4 | 0.01 | <0.01 | <0.01 | <0.01 | <0.01 | <0.01 | <0.01 | <0.01 | <0.01 |
| Fluoranthene | 0.56 | 1.15 | 0.88 | <0.01 | 0.78 | 0.28 | 0.1 | 0.01 | <0.01 | <0.01 | 0.01 | <0.01 | <0.01 | <0.01 | <0.01 | <0.01 |
| Pyrene | 0.19 | 0.18 | 0.31 | 0.02 | 0.48 | 2.95 | 0.04 | 0.02 | <0.01 | <0.01 | 0.02 | <0.01 | <0.01 | <0.01 | <0.01 | <0.01 |
| Benzo (a) anthracene | 0.79 | 0.67 | 1.13 | 0.08 | 0.65 | 0.9 | 0.39 | <0.01 | <0.01 | <0.01 | <0.01 | <0.01 | <0.01 | <0.01 | <0.01 | <0.01 |
| Chrysene | 0.04 | 1.27 | 0.03 | 0.01 | 0.14 | 0.02 | 0.17 | 0.07 | <0.01 | <0.01 | <0.01 | 0.01 | 0.03 | <0.01 | <0.01 | <0.01 |
| Benzo (b) fluoranthene | 0.11 | 0.25 | 0.26 | 0.01 | 0.09 | 0.01 | 0.07 | 0.01 | <0.01 | <0.01 | <0.01 | <0.01 | <0.01 | <0.01 | <0.01 | <0.01 |
| Benzo (k) fluoranthene | 0.02 | 0.16 | 0.06 | 0.02 | 0.16 | 0.02 | 0.31 | 0.01 | <0.01 | <0.01 | <0.01 | <0.01 | <0.01 | <0.01 | <0.01 | <0.01 |
| Benzo (a) pyrene | 0.03 | 0.08 | 0.06 | 0.03 | 0.04 | 0.03 | 0.24 | 0.01 | <0.01 | <0.01 | <0.01 | <0.01 | <0.01 | <0.01 | 0.04 | 0.01 |
| Dibenz(a,h)anthracene | 0.05 | 0.03 | 0.02 | 0.02 | 0.03 | 0.09 | 0.03 | 0.01 | 0.01 | 0.04 | 0.01 | 0.01 | 0.01 | 0.01 | 0.01 | 0.01 |
| Indeno(1,2,3-cd)pyrene | 0.02 | 0.11 | 0.04 | 0.07 | 0.02 | 0.02 | 0.09 | 0.03 | <0.01 | 0.02 | 0.06 | <0.01 | <0.01 | <0.01 | <0.01 | <0.01 |
| Benzo (g,h,i) perylene | 0.09 | 0.08 | 0.1 | 0.05 | 0.05 | 0.08 | 0.02 | 0.05 | <0.01 | <0.01 | <0.01 | <0.01 | <0.01 | <0.01 | <0.01 | <0.01 |
| Total | 18.65 | 16.37 | 16.19 | 0.7 | 16.66 | 11.98 | 9.36 | 0.34 | 0.01 | 0.06 | 0.1 | 0.02 | 0.06 | 0.01 | 0.05 | 0.02 |
| Table 3: Result of statistical analysis compared with control site and regulatory guidelines. | ||||||||||||||||||||||
| Depth (m) | 0.1m | 0.5m | 1.0m | 1.5m | Control | DPR limits | ||||||||||||||||
| Statistical analysis | Min | Max | Mean | S.D. | Min | Max | Mean | S.D. | Min | Max | Mean | S.D. | Min | Max | Mean | S.D. | 0.1m | 0.5m | 1m | 1.5m | DPR T | DPR I |
| TPH, mg/kg | 99 | 30784 | 7964 | 11797 | 98.81 | 19512 | 4226 | 78001 | 99.13 | 18873 | 3792 | 7095 | 74.98 | 1516 | 658.32 | 560 | 19.78 | 23.88 | 17.66 | 24.50 | 50.00 | 5000.00 |
| PAH, mg/kg | 1.00 | 40.00 | ||||||||||||||||||||
| Naphthalene | 0.01 | 0.22 | 0.09 | 0.09 | 0.01 | 0.11 | 0.05 | 0.04 | 0.01 | 0.07 | 0.03 | 0.03 | 0.01 | 0.01 | 0.01 | 0.00 | <0.01 | <0.01 | <0.01 | <0.01 | ||
| Acenaphthylene | 0.08 | 12.38 | 5.58 | 6.01 | 0.02 | 7.81 | 1.89 | 3.26 | 0.01 | 9.43 | 3.01 | 4.32 | 0.01 | 0.06 | 0.03 | 0.02 | <0.01 | <0.01 | <0.01 | <0.01 | ||
| Acenaphthene | 0.01 | 1.24 | 0.56 | 0.49 | 0.01 | 0.40 | 0.15 | 0.17 | 0.01 | 0.95 | 0.27 | 0.45 | 0.01 | 0.01 | 0.01 | 0.00 | <0.01 | <0.01 | <0.01 | <0.01 | ||
| Fluorene | 0.01 | 2.94 | 0.91 | 1.22 | 0.02 | 2.18 | 0.45 | 0.78 | 0.01 | 1.50 | 0.46 | 0.66 | 0.01 | 0.07 | 0.03 | 0.03 | 0.02 | <0.01 | <0.01 | <0.01 | ||
| Anthracene | 0.01 | 3.86 | 0.89 | 1.35 | 0.01 | 1.16 | 0.24 | 0.37 | 0.01 | 0.82 | 0.24 | 0.30 | 0.02 | 0.23 | 0.06 | 0.09 | <0.01 | <0.01 | <0.01 | <0.01 | ||
| Phenanthrene | 0.01 | 3.90 | 0.98 | 1.44 | 0.01 | 1.66 | 0.34 | 0.65 | 0.01 | 1.00 | 0.26 | 0.39 | 0.01 | 0.03 | 0.02 | 0.01 | <0.01 | <0.01 | <0.01 | <0.01 | ||
| Fluoranthene | 0.06 | 1.90 | 0.58 | 0.64 | 0.02 | 1.15 | 0.24 | 0.41 | 0.02 | 0.88 | 0.21 | 0.33 | 0.01 | 0.05 | 0.02 | 0.02 | <0.01 | <0.01 | 0.01 | <0.01 | ||
| Pyrene | 0.01 | 1.87 | 0.37 | 0.63 | 0.01 | 2.95 | 0.48 | 1.09 | 0.02 | 0.31 | 0.11 | 0.13 | 0.01 | 0.03 | 0.02 | 0.01 | <0.01 | <0.01 | 0.02 | <0.01 | ||
| Benzo (a) anthracene | 0.02 | 1.32 | 0.72 | 0.54 | 0.02 | 0.90 | 0.29 | 0.39 | 0.01 | 1.13 | 0.30 | 0.43 | 0.01 | 0.08 | 0.03 | 0.03 | <0.01 | <0.01 | <0.01 | <0.01 | ||
| Chrysene | 0.03 | 1.65 | 0.52 | 0.68 | 0.01 | 1.27 | 0.22 | 0.46 | 0.01 | 0.17 | 0.07 | 0.07 | 0.01 | 0.07 | 0.03 | 0.02 | 0.03 | <0.01 | <0.01 | 0.01 | ||
| Benzo (b) fluoranthene | 0.03 | 0.54 | 0.19 | 0.20 | 0.01 | 0.25 | 0.09 | 0.09 | 0.01 | 0.26 | 0.09 | 0.10 | 0.01 | 0.01 | 0.01 | 0.00 | <0.01 | <0.01 | <0.01 | <0.01 | ||
| Benzo (k) fluoranthene | 0.01 | 1.08 | 0.18 | 0.37 | 0.01 | 0.16 | 0.07 | 0.06 | 0.01 | 0.31 | 0.09 | 0.12 | 0.01 | 0.02 | 0.01 | 0.00 | <0.01 | <0.01 | <0.01 | <0.01 | ||
| Benzo (a) pyrene | 0.03 | 0.64 | 0.14 | 0.22 | 0.01 | 0.09 | 0.04 | 0.03 | 0.01 | 0.24 | 0.06 | 0.08 | 0.01 | 0.03 | 0.02 | 0.01 | <0.01 | <0.01 | 0.04 | 0.01 | ||
| Dibenz(a,h) anthracene |
0.01 | 0.44 | 0.07 | 0.15 | 0.01 | 0.10 | 0.04 | 0.03 | 0.01 | 0.06 | 0.02 | 0.02 | 0.01 | 0.03 | 0.02 | 0.01 | 0.01 | 0.03 | 0.01 | 0.01 | ||
| Indeno(1,2,3-cd)pyrene | 0.02 | 0.15 | 0.05 | 0.05 | 0.01 | 0.11 | 0.03 | 0.04 | 0.01 | 0.09 | 0.04 | 0.03 | 0.03 | 0.07 | 0.04 | 0.02 | <0.01 | 0.02 | 0.06 | <0.01 | ||
| Benzo (g,h,i) perylene | 0.01 | 0.23 | 0.07 | 0.07 | 0.01 | 0.10 | 0.05 | 0.03 | 0.01 | 0.10 | 0.03 | 0.03 | 0.01 | 0.05 | 0.03 | 0.02 | <0.01 | <0.01 | <0.01 | <0.01 | ||
| Total | 0.02 | 28.49 | 7.81 | 10.27 | 0.04 | 16.37 | 3.23 | 5.88 | 0.01 | 16.19 | 2.81 | 5.50 | 0.01 | 0.70 | 0.23 | 0.22 | 0.04 | 0.04 | 0.08 | 0.02 | ||
| DPR T – Target value DPR I – Intervention value | ||||||||||||||||||||||
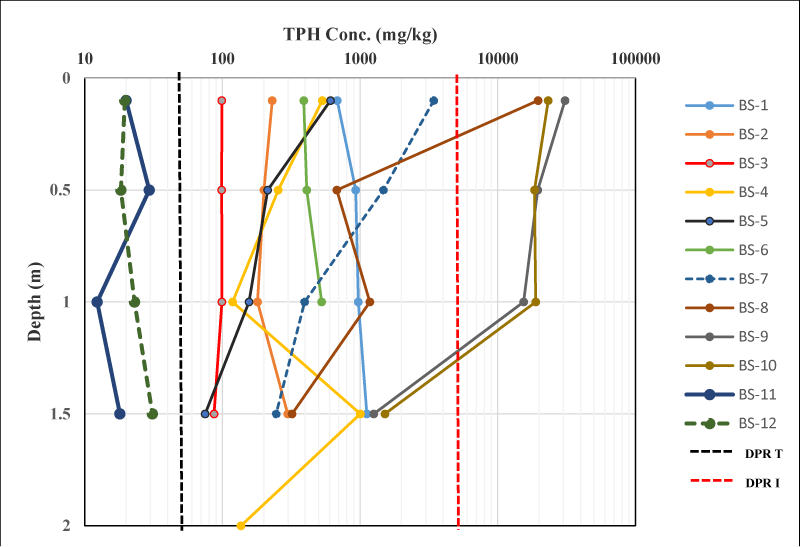
Figure 2: Total Petroleum Hydrocarbons variation with depth across all the sampled locations along with DPR target and intervention values (DPR T - DPR target, DPR I – DPR Intervention, BS-11 and BS-12 – Control samples).
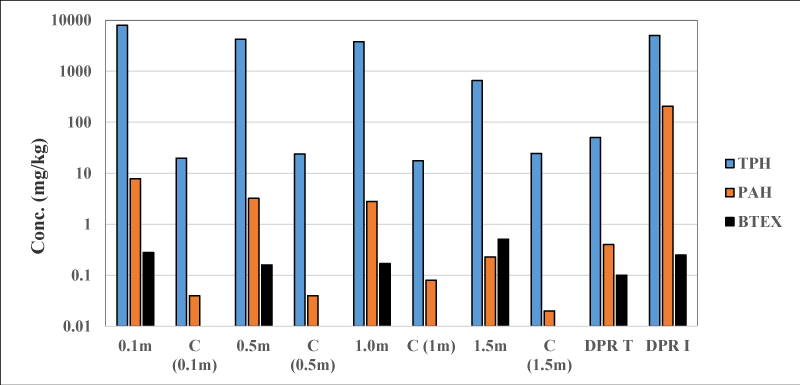
Figure 3: Average concentrations of petroleum contaminants compared with the control and DPR regulatory guidelines.
At 0.5 m depth, TPH ranges from 98.81 to 19512 mg/kg with mean and SD of 4226 ± 78001 mg/kg. The highest TPH at this depth is obtained from BS-9 while the lowest is obtained from BS-3 (Table 2a). Meanwhile at the control, TPH at this depth is 23.88 mg/kg which is an indication of no possible hydrocarbon contamination based on TPH content. Again at this depth, all the sample locations around the spill area exceeded the DPR target values while only BS-9 and BS-10 exceeded DPR intervention values. Average TPH concentration at this depth exceeded DPR target value of 50 mg/kg by over 84 times (Figure 2).
The concentration of TPH at 1.0 m depth ranges from 99.13 mg/kg at BS-3 to 18873 mg/kg at BS-10 (Table 3). These concentrations are higher than those obtained from the control site (17.77 mg/kg) and DPR target value of 50 mg/kg (Figure 3).
The mean and SD for TPH at 1.0m depth is 658.32 ± 560 mg/kg which is higher than the DPR target value but within the DPR intervention value of 5000 mg/kg (Figure 4).
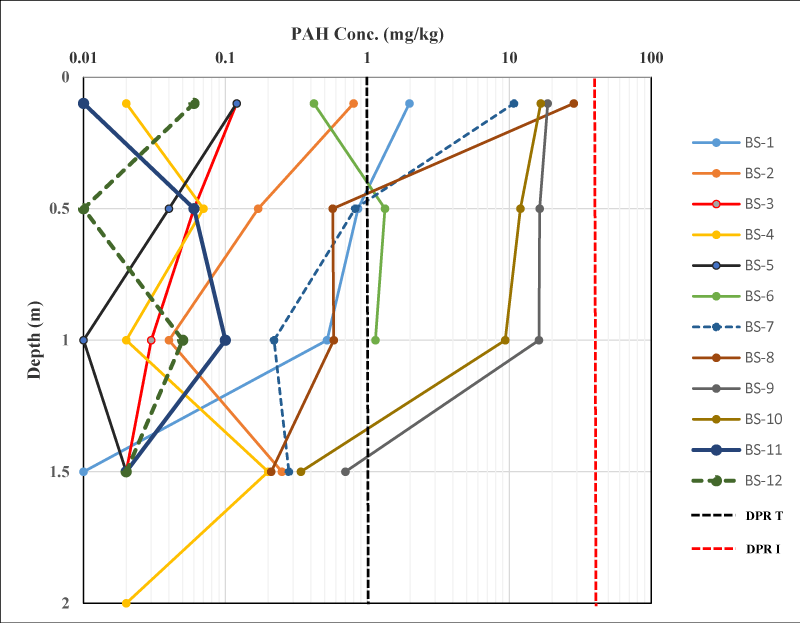
Figure 4: Polycyclic Aromatic Hydrocarbons variation with depth across all the sampled locations along with DPR target and intervention values (DPR T - DPR target, DPR I – DPR Intervention, BS-11 and BS-12 – Control samples).
At a depth of 1.5m, the TPH in soil ranged from 74.98 to 1516 mg/kg with mean and SD of 658.32 ± 560 mg/kg. The highest TPH is obtained from BS-10 while the lowest is obtained from BS-5. The TPH concentration obtained at this depth exceeded those at the control (24.50 mg/kg) and DPR regulatory limit of 50 mg/kg. The concentration of TPH at BS-10 exceeded DPR target value by over 300%. The average concentration of TPH exceeded DPR target value by over 130%. Only BS-4 was sampled to a depth of 2.0m and had a TPH value of 136 mg/kg which exceeded DPR target value, but is within the intervention value (Table 2).
Polycyclic aromatic hydrocarbons in soil
The polycyclic Aromatic Hydrocarbons (PAH) are a group of compounds which includes; Naphthalene, Acenaphthylene, Acenaphthene, Fluorene, Anthracene, Phenanthrene, Fluoranthene, Pyrene, Benzo (a) anthracene, Chrysene, Benzo (b) fluoranthene, Benzo (k) fluoranthene, Benzo (a) pyrene, Dibenz(a,h) Anthracene, Indeno (1,2,3-cd) pyrene and Benzo (g,h,i) perylene. All these compounds were analyzed in the soil samples from the spill area. In the top soil (0.1m), PAH ranged from 0.02 to 28.49 mg/kg with a mean and SD of 7.81±10.27 mg/kg (Table 3). At this depth the PAH concentration is highest at BS-8 and lowest at BS-4 (Table 2). The main contributing compounds to the high PAH value obtained at BS-8 are Acenaphthylene (12.38mg/kg), Acenaphthene (1.24 mg/kg), Fluorene (2.94 mg/kg), Anthracene (3.86 mg/kg) and Phenanthrene (3.9 mg/kg) (Table 2). At the control site, the highest detectable PAH is 0.01 mg/kg while DPR target and intervention values are 1.0 and 40 mg/kg. The average PAH at this depth exceeded those of the control and DPR target value, but lies within the DPR intervention limit for safe industrial soils (Figure 4).
The soil PAH at 0.5 m depth ranges from 0.04 to 16.37 mg/kg and has a mean and SD value of 3.23 ± 5.8 mg/kg. The highest concentration is obtained from BS-9 and the lowest from BS-5. The mean concentration is higher than those obtained from the control (0.04 mg/kg) and DPR target values, but within the intervention limit (Figure 5). In order of decreasing magnitude, PAH concentration in soils at this depth is as follows; BS-9> BS-10> BS-8> BS-2> BS-6> BS-1 >BS-7> BS-3 (Table 2).
At 1.0m, PAH ranged from 0.01 to 16.19 mg/kg with mean and SD of 2.81 ± 5.5 mg/kg (Table 3). The highest PAH is obtained from BS-9 with the main contribution from Benzo (a) anthracene (1.13 mg/kg), Fluorene (1.08 mg/kg), Anthracene (0.82mg/kg), Phenanthrene (1.0 mg/kg) and Fluoranthene (0.88 mg/kg) (Table 2). The average PAH concentration exceeds those of the control (0.08 mg/kg) and DPR target value of 1.0 mg/kg (Figure 5).
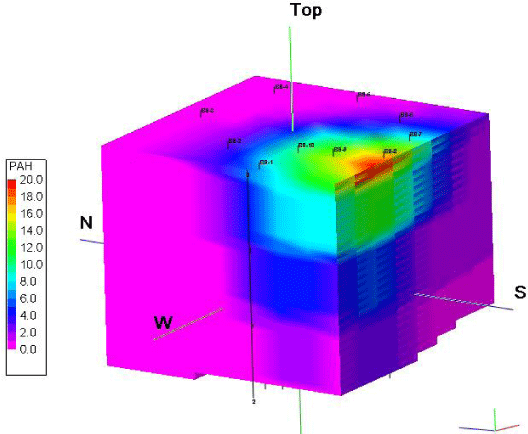
Figure 5: 3-D block model showing the horizontal and vertical variations in PAH concentration around the spill area.
The concentration of PAH at 1.5m depth ranges from 0.01 to 0.7 mg/kg with a mean and SD of 0.23 ± 0.22 mg/kg (Table 3). The concentration of PAH at the control site is 0.02 mg/l. These concentrations are within the DPR target limit of 1.0 for safe industrial soils (Figure 4). The concentration of PAH of 0.2 mg/kg was recorded at a depth of 2.0m depth at BS-4 (Table 2). This is well within the DPR target value of 1.0 mg/kg for safe industrial soils.
Modelling hydrocarbon contaminated soils
In this study, 3-D block models were generated for the petroleum hydrocarbon contaminants (TPH, PAH and BTEX) in order to visualize the area covered by the contaminants, determine the behavior of the contaminants with depth and also estimate the volume of spill which exceeded regulatory limits. The control site was not included as part of the generated 3-D block model due to the wide distance away from the centre of the spill area. The soil sample locations (apart from the control site) and depth were important inputs during the buildup of the 3-D grid. From the input parameters, the volume of the spill area was calculated as 1,198,500m3.
PAH contaminant modelling
Figure 5 shows the 3-D block volume for PAH contamination across the spill area. The model reveals that the highest concentration of the contaminants is situated at the south-western part of the study area. Three zones can be distinguished from the PAH model (Figure 5) and the cross-section generated across the area (Figure 6). Highly contaminated areas (Zone 1= BS-8, BS-9, BS-10), moderately contaminated areas (Zone 2= BS-1, BS-2, BS-5, BS-7) and low contaminated areas (Zone 3= BS-3, BS-4, BS-6). The 3-D block diagram (Figure 5), cross-sectional profile (Figure 6) along with depth slices extracted at 0.1m, 0.5 m, 1.0 m and 1.5 m (Figure 7) revealed that the PAH concentration in the soil decreases with increasing depth. On the 3-D block volume, the DPR target value of 1.0mg/kg was applied as a cut-off, and a new volume generated (Figure 10). The new volume was 563,000m3 in size and shows the areas having concentrations higher than the DPR target value. Because BS-3, BS-4 and BS-6 all have concentrations within DPR target values, after the cut-off was applied, there were exempted from the new model. This model showed area required immediate remediation actions.
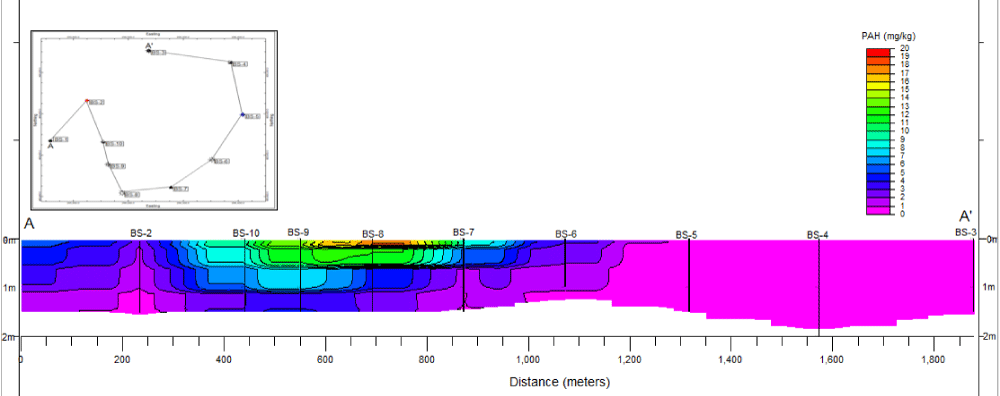
Figure 6: 3A cross-section across the entire wells showing PAH variations with depth.
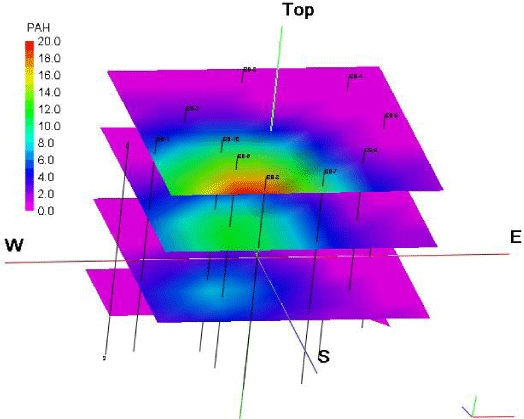
Figure 7: Depth slices extracted from the 3-D PAH grid model at 0.1 m, 0.5 m, 1.0m and 1.5 m around the spill area.
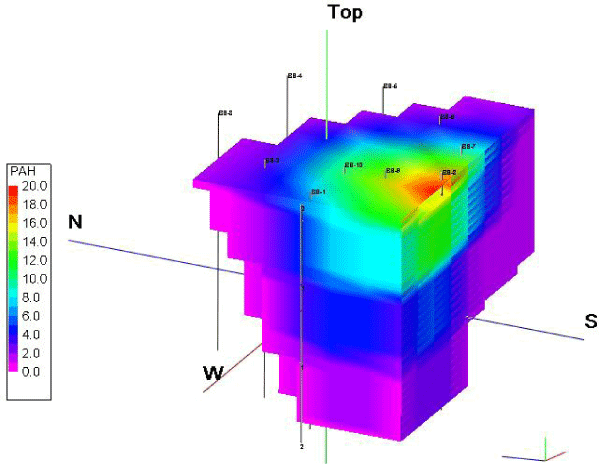
Figure 8: 3-D block model showing the horizontal and vertical variations in PAH concentration around the spill area after applying the DPR target value (1.0 mg/kg) as a cutoff (Volume 563,000m3).
TPH contaminant modelling
The TPH contaminant 3-D block model is presented in figure 8. The model revealed that the contaminant concentration is highest in the south-western part of the 3-D grid. This is quite similar with the results obtained from the TPH model. Figure 10 is a cross-section across the entire wells showing TPH variations with depth and offset distance. From the block model and the cross-section, three contamination zones can be distinguished in a similar manner as with the PAH. The zones include; highly contaminated areas (Zone 1= BS-8, BS-9, BS-10), moderately contaminated areas (Zone 2 = BS-1, BS-2, BS-6, BS-7), and low contaminated zones (Zone 3= BS-3, BS-4, BS-5). Figure 9 are depth slices extracted from the TPH 3-D grid model at 0.1 m, 0.5 m, 1.0 m and 1.5 m around the spill area. The 3-D grid, cross sectional profile and time slices all shows that the contaminant concentration decreases with depth around the spill centre. The entire spill area (volume = 1,198, 500m3) have TPH concentrations that exceeded the DPR target value of 50 mg/kg. Applying the DPR intervention cut-off value of 5000 mg/kg led to the generation of a new gridded volume (Figure 9). The new volume (222,500 m3) revealed areas that were harmful to human health and in need of immediate remediation actions. These include areas around BS-8, BS-9, BS-10, BS-1 and the shallow part of BS-7.
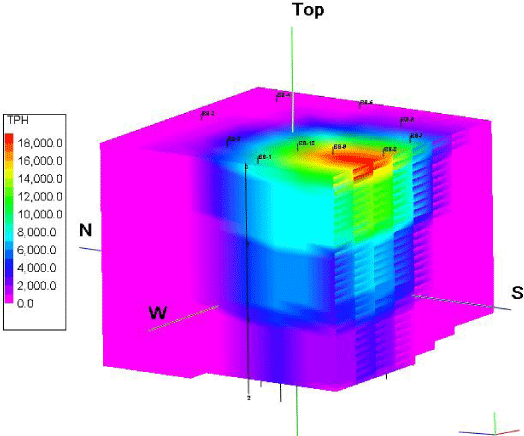
Figure 9: 3-D block model showing the horizontal and vertical variations in TPH concentration around the spill area.
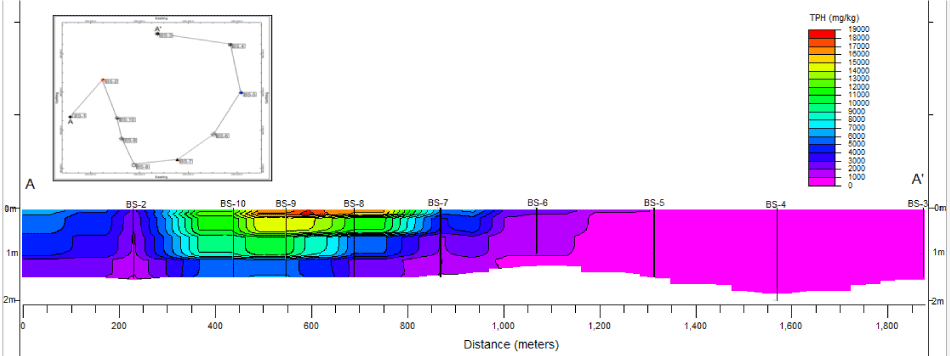
Figure 10: A cross-section across the entire wells showing TPH variations with depth.
Geochemical analysis showed that TPH concentration at all locations and all depths exceeded DPR target value of 50 mg/kg. The TPH model revealed that a total volume of 222,500m3 of the spill area exceeded DPR intervention value of 5000mg/kg. The results of PAH showed that only BS-1, BS-6, BS-8, BS-9 and BS-10 exceeded DPR target value of 1.0 mg/kg at some depths. All other sample depths and locations are within the target limit. The 3-D grid generated for PAH showed that 563,000 m3 of the study area exceeded the DPR target value.
The 3-D block models generated for TPH and PAH, along with the cross-sections and extracted time slices all shows that the concentration of these COC generally decrease with depth, and the centre of the spill is located at the south-eastern part of the survey area. Based on these models, three spill zones were identified; Zone 1-highly contaminated areas (BS-8, BS-9, BS-10); Zone 2- moderately contaminated areas (BS-1, BS-2, BS-6, BS-7); and low contaminated areas (BS-3, BS-4, BS-5).
The assessment of soil in the vicinity of an oil spill incident in Bonny has revealed that the soil quality and borehole water quality are deteriorated at the centre of the spill incident. The entire soil in the area is contaminated with TPH and 47% of the area is contaminated with PAH. This study has shown the effectiveness of the use of a model-based approach in quantifying hydrocarbon contamination volumes.
- Aiyesanmi AF. Assessment of heavy metal contamination of Robertkiri oil field's soil. Nigerian J Soil Sci. 2005; 15: 42-46.
- Olujimi JAB, Emmanuel AA, Sogbon O. Environmental implications of oil exploration and exploitation in the coastal region of Ondo State, Nigeria: A regional planning appraisal. J Geo Reg Plann. 2011; 4: 110-121.
- Roane TM, Kellogg ST. Characterization of bacterial communities in heavy metal contaminated soil. Canadian Microbiol. 1996; 42: 593-603.
- Ikelegbe A. The Economic of Conflict in the Oil Rich Niger Delta Region of Nigeria. J Third World Studies. 2005; 43: 24-50.
- Amadi AN, Nwankwoala HO, Olasehinde PI, Okoye NO, Okunlola IA, et al. Investigation of Aquifer Quality in Bonny Island, Eastern Niger Delta, Nigeria using Geophysical and Geochemical Techniques. J Emerg Tren Engineering Appli Scie. 2012; 3: 180-184.
- Ferguson C, Kasamas H. Risk assessment for contaminated sites in Europe. Policy Framework. LQM Press, Nottingham. 1999; 2: 1-6.
- USEPA. United States Environmental Protection Agency. Risk assessment guidance for superfund. Human health evaluation manual. 1989; 540: 1-89.
- ATSDR. Toxicological profile for polycyclic aromatic hydrocarbons (PAH). Atlanta, GA, U.S Department of Health and Human Services, Public health service, agency for toxic substances and disease registry, United States of America. 1995.
- Rizzardini CB, Goi D. Sustainability of domestic sewage sludge disposal. Sustainability. 2014; 6: 2424–2434.
- Anyanwu JO. Maritime Tanker Accident on Coastal Areas in Nigeria. Global J Res Engineering. 2014; 14: 7-11.
- Nwankwoala HO, Mzaga TM. Sub-Soil Properties of Hydrocarbon Contaminated Sites in Parts of The Eastern Niger Delta, Nigeria. Open Access J Environment Soil Sci. 2019; 2.
- Nwankwoala HO, Omofuophu E. Investigation of Hydrocarbon Contaminant Levels and Groundwater Quality Assessment in Parts of Bonny Island, Rivers State, Nigeria. Central Asian J Environ Sci Technol Innov. 2020; 1: 61 – 70
- Stuart PC, Richard SJ. Gas chromatography. Analytical Chemistry. 1972; 44: 213-241.
- Pinedo J, Ibáñez R, Lijzen JPA, Irabien T. Assessment of soil pollution based on total petroleum hydrocarbons and individual oil substances. Journal of Environ. Manag. 2013; 130: 72–79. PubMed: https://www.ncbi.nlm.nih.gov/pubmed/24064142
- Kanaki M, Nikolaou A, Makri CA, Lekkas DF. The occurrence of priority PAHs, nonylphenol and octylphenol in inland and coastal waters of central Greece and the island of Lesvos. Desalination. 2007; 210: 16-23.
- Wan Y, Xiaohui J, Jianying H, Fen J. Trophic Dilution of Polycyclic Aromatic Hydrocarbons (PAHs) in a Marine Food Web from Bohai Bay, North China. Environ Sci Technol. 2007; 41: 3109-3114. PubMed: https://www.ncbi.nlm.nih.gov/pubmed/17539512
- IDPH (Illinois Department of Public Health). (2005). Environmental health fact sheet: polycyclic aromatic hydrocarbons.
- Nwankwoala HO, Mzaga TM. Geo-Environmental Assessment of Hydrocarbon Contaminated Sites in Parts of Central Swamp Depobelt, Eastern Niger Delta. MOJ Eco Environ Sci. 2017; 2: 00023.
- UNEP. Environmental Assessment of Ogoni Land (Executive Summary). Publication. 2010.
- United Nations Environment Programme. UNEP. Environmental Assessment of Ogoniland. 2011; 1–198. http://www.unep.org.
- USEPA (United States Environmental Protection Agency). Risk Assessment Guidance for Superfund, Volume I Human Health Evaluation Manual, Part B (Development of Risk-based Preliminary Remediation Goals); EPA/540/R-92/003; Office of Emergency and Remedial Response: Washington, DC, USA, 1991.
- USEPA (United States Environmental Protection Agency). CASRN—71-43-2 Integrated Risk Information System (IRIS); Chemical Assessment Summary; National Center for Environmental Assessment: Washington, DC, USA, 2000.
- USEPA (United States Environmental Protection Agency). The Air Toxics Hot Spots Program Guidance Manual for Preparation of Health Risk Assessments; Office of Environmental Health Hazard Assessment California Environmental Protection Agency: Sacramento, CA, USA, 2003.
- USEPA (United States Environmental Protection Agency). RAIS the Risk Assessment Information System, Glossary of Environmental Restoration Terms; United States Environmental Protection Agency: Washington, DC, USA, 2016.
- USEPA. United States Environmental Protection Agency. Technical factsheet on: polycyclic aromatic hydrocarbons (PAHs). Washington, DC: http://www.epa.gov/OGWDW/pdfs/factsheets/soc/tech/pahs.pdf