
More Information
Submitted: 25 March 2020 | Approved: 16 April 2020 | Published: 17 April 2020
How to cite this article: Karim MA, John TW. A comparative study of solid waste management in the United States, Europe and Asia. Ann Civil Environ Eng. 2020; 4: 003-011.
DOI: 10.29328/journal.acee.1001019
Copyright License: © 2020 Karim MA, et al. This is an open access article distributed under the Creative Commons Attribution License, which permits unrestricted use, distribution, and reproduction in any medium, provided the original work is properly cited.
Keywords: Municipal solid waste; Solid waste management; Decision matrix; Purposive sampling; Meta-analysis

A comparative study of solid waste management in the United States, Europe and Asia
MA Karim1* and John Taylor Wetterhan2
1Associate Professor, Department of Civil and Environmental Engineering, Kennesaw State University, Marietta Campus, 655 Arntson Drive, Marietta, Georgia 30060, USA
2Undergraduate Student, College of Engineering, University of Georgia, Athens, Georgia 30602, USA
*Address for Correspondence: Karim MA, Associate Professor, Department of Civil and Environmental Engineering, Kennesaw State University, Marietta Campus, 655 Arntson Drive, Marietta, Georgia 30060, USA, Tel: 470-578-5078; 804-986-3120; Email: [email protected]; [email protected]
Managing municipal solid waste correctly is critical to the success of a society. Many regions and countries in the world are behind others in the context of solid waste management. In order to compare three such regions within this context, a meta-analysis was conducted in order to develop a decision matrix. Within this decision matrix, the United States, Europe, and Asia were compared to determine which region is managing municipal solid waste the best. This research design allowed for compiling information from many sources to increase the accuracy of data used in the justifications for the decision matrix. Purposive sampling was used to select and evaluate sources that discuss solid waste management to discern which region’s processes are most favorable in many parameters. The decision matrix consists of nine parameters: main management techniques; finances; landfill taxes; jobs created; waste generation; waste composition; waste storage, collection, and transportation; energy recovery; and environmental health. Each was scored on a scale from zero to ten, ten being the best score and zero being the worst. The final score from the decision matrix suggested that Europe had the most favorable municipal solid waste management (MSWM) system, and the United States had a notably close yet lower score. Asia had the lowest score that was hardly comparable to the other two regions.
Municipal Solid Waste (MSW), commonly called “trash” or “garbage,” includes wastes such as durable goods (e.g., tires, furniture), nondurable goods (e.g., newspapers, plastic plates/cups), containers and packaging (e.g., milk cartons, plastic wrap), and other wastes (e.g., yard waste, food). MSW generally refers to common household waste, as well as office and retail wastes, but excludes industrial, hazardous, and construction wastes. A lack of municipal solid waste management (MSWM) is an underlying problem as society grows. Urban areas tend to contain great quantities of MSW, which are the trash and solid materials that society discards once they become useless [1]. Population growth, rapid urbanization, and industrialization have been drastically increasing and changing the solid waste that society produces, as well as the amount that litters the streets [2,3].
The amount of solid waste present in society is continuing to grow [4]. As this occurs, environmental and human health increasingly becomes a concern [2]. Different forms of pollution, diseases, and pest infestations can occur unless governments and industries manage MSW properly [1]. Sadly, instead of well implemented, safe methods of MSWM, the public turns to unsafe methods like open dumping, which occurs when people decide to dispose of their waste by throwing it out wherever they please [4]. Not only does the lack of management fail to solve the problem, but it also propagates the issue even further. Poor management methods promote a buildup of MSW [3]. These problems are present in the country of Bangladesh, particularly open dumping and a distinct lack of planning to correctly dispose of the copious amounts of MSW that large urban populations produce [4].
Day-to-day management of solid waste is a complex and costly undertaking. The direct activities that must be considered and coordinated on a daily basis include waste generation rates, on-site storage, collection, transfer and transport, processing and recovery, and final disposal. The indirect activities that are associated with the management of solid waste include: financing, operations, equipment, personal, cost accounting and budgeting, contract administration, ordinances and guidelines, and public communications. The relationships between the direct activities of solid waste management is shown in figure 1. The recent adopted solid waste management hierarchy is shown in figure 2.
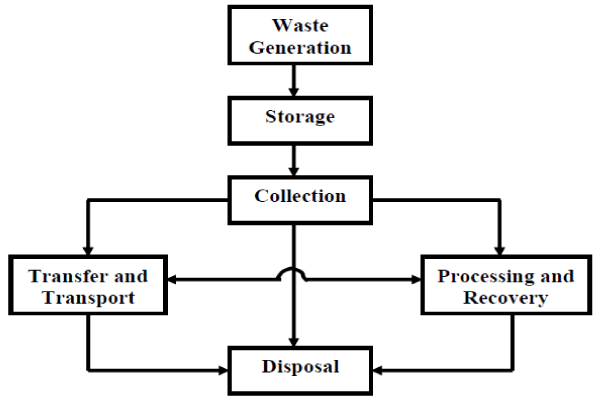
Figure 1: Interrelationship between the direct activities of solid waste management.
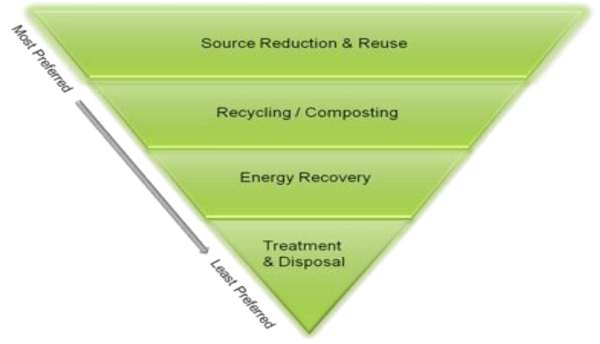
Figure 2: Waste management hierarchy based on recent changes.
The study is a qualitative and comparative meta-analysis using a decision matrix that compares the MSWM processes of three major regions: The United States, Europe, and Asia (mostly Southern Asia). This study was accomplished through utilization of purposive sampling to select and evaluate sources that discuss solid waste management and by comparing the processes to discern which is the most favorable in many factors [5]. From this, the most favorable method was applied to Bangladesh and their waste situation with consideration to many parameters, ranging from economics to environmental health, so that they may be able to reform their MSWM. As discussed earlier, Bangladesh has many problems that stem from poor MSWM, so an attempt to fix the MSW issue could potentially improve the quality of life in Bangladesh [4]. Mostly ordinal data was used to create the decision matrix and ranked the “best” region as it relates to MSWM [6].
The main objective of this article is to provide a comprehensive knowledge of solid waste management practices for three different regions that can be followed by other developing regions to better manage their solid wastes. This study is expected to help solid waste management planners, managers, operators, and other authorities involved in solid waste management practices in a country, city, town, or region.
Research parameters for scoring
In order develop a parameter-based decision matrix, the following nine parameters were selected and used with a scoring scale of zero to ten. The parameters were explained below:
Main management techniques: This score is indicative of how well the region uses its MSWM techniques, as well as which techniques they use.
Finances: This score shows how well the region utilizes money when sustaining and improving MSWM.
Landfill taxes: This score indicates whether the regulation of landfills includes landfill taxes.
Jobs created: This score indicates if the region’s MSWM processes result in a sustainable job market.
Waste generation: This score signifies an effort to reduce waste generation in the region.
Waste composition: This score shows whether the region is using the correct MSWM techniques when considered in the context of waste composition.
Waste storage, collection, and transportation: This score measures whether the region has an effective waste storage, collection, and transportation process.
Energy recovery: This score measures whether the region recovers a notable amount of energy with their MSWM techniques.
Environmental health: This score gives an indication of environmental health as it pertains to MSWM.
Assumptions
An assumption from the Multi attribute Value Theory (MAVT) method of decision-making is that the decision-maker is consistent in judgment and rational [7]. This is reasonable because of the time the study took to analyze the data and develop the decision matrix. Another assumption from the meta-analysis is that all the sources of samples are, within reason, accurate and unbiased. This is also reasonable because the sampled sources are from either government-published databases or are peer-reviewed sources from trusted databases such as GALILEO, a Georgia Library database, and National Center for Biotechnology Information (NCBI), a government-affiliated publisher.
Data collection, processing, and analysis
Raw data was collected from three regions: The United States, Europe (mainly European Union), and Asia using purposive sampling and then converted them into comparable measurements between time and space for each region. Afterwards, those measurements were used to fill the parameters in a decision matrix. After completing the decision matrix, the information was used to decide which techniques work the best and why by assigning a rating (between zero and ten, depending on how successful they are). Scores were assigned based on how successful each region was through careful judgment, and heavy consideration of the original authors’ opinions as voiced in their articles. Afterward, the most favorable region was used as a template for designing a new system for Bangladesh to use in order to manage their MSW better.
MSWM is one of the important services provided by local authorities [8]. However, in most developed countries, MSWM is privatized for competitive service and those countries have produced many methods to dispose of household waste in a manner that is good for environmental and public health, is profitable, and is practical [3]. Also, rapid urbanization and industrialization have plagued many countries with an overabundance of MSW [1,3,4,9]. Additionally, the underuse of many MSW disposal methods, with landfilling undoubtedly being the main one, has resulted in a unique set of problems that have lasted many years [3]. Therefore, it is important to analyze each method, the general environmental impact of the method, and whether it will work for a country, as several researchers have done before.
Rapid urbanization, poor environmental health, and little to no MSWM are problems that are present in the country of Bangladesh [4]. By creating a decision-making model that considers the various parameters specified in in here, the MSWM methods of the three specified regions were compared The following sections contain the results of the study as it pertains to the first question, as well as the justifications behind each of the scores that were awarded to the United States, Europe, and Asia.
The first goal of this study was to determine the most favorable MSWM system from the United States, Europe, and Asia. A meta-analysis was conducted to collect information for the consideration of each score in every parameter in the decision matrix. The scores in every single parameter are between zero and ten. It is important to mention here that the score scale and assignment are arbitrary and may differ greatly from study to study and person to person depending on the experience and personal judgement. However, this can give us a perspective of MSWM system to start with. A zero indicates that the parameter is practically non-existent or is not part of the MSWM system as the sources described them. A ten indicates that the region executes or displays a parameter nearly perfectly. For example, if a region received a ten under the parameter “environmental health,” it would indicate that the region has very negligible to no pollution due to MSW practices. Contrarily, if a region received a zero under the parameter “energy recovery,” this means that the region does not practice energy recovery of MSW, such as through WTE methods. Because each parameter is so broad, a score may be due to the extent at which the region prioritizes or involves the parameter in their MSWM systems, rather than whether it is there or not.
When considering MSWM systems of several regions, particularly regions of differing sizes and economic advancements, it is important to also consider the demographical and geographical information of a region [10]. For example, if a country had a very limited landmass, like Japan, then that country would be unable to pursue landfilling as a MSWM technique and would need to practice other techniques out of necessity. Likewise, if an underdeveloped country with a low GDP were to produce more MSW than the system that is already in place can manage, they may be unable to expand upon their system and thus suffer the effects of poor MSWM. Demographical and geographical information of the United States, Europe, and Asia is provided in table 1.
| Table 1: Demographical and geographical data for the United States, Europe, and Asia. | |||
| Data Type | Regions | ||
| United States a,b | Europe b,c | Asiab,d,e | |
| Population | 329,256,465 | 517,111,329 | 4,545,133,00 |
| Land Mass | 9,833,517 | 4,479,968 | 44,579,000 |
| Population Density | 33 | 115 | 102 |
| GDP | 21.34 | 21.79 | 31.58 |
| GDP per capita | 59,800 | 40,900 | 6,948 |
| PCE | 68.40% | 54.40% | -- |
| a(Central Intelligence Agency, 2019a). b(International Monetary Fund, 2019). c(Central Intelligence Agency, 2019b). d(United Nations, 2017). e(Worldatlas, 2017). | |||
Using the sources found through the meta-analysis, a decision matrix (Table 2) was established to determine the region that has the most favorable MSWM system. It is important to remember that decision matrices are subjective by nature, though justified, as readers examine the scores given [7]. The following table 2 shows the decision matrix that was developed through this study using the parameters specified with scoring scale of zero to ten. A score of zero indicates very little to no execution or involvement of the parameter, and a ten indicates nearly perfect execution or involvement of the parameter.
| Table 2: Decision matrix that determined the most favorable method of MSWM in three regions | ||||
| Parameters | Regions | Comments | ||
| United States | Europe | Asia | ||
| MainManagement Techniques | 6 | 6 | 2 | Tiebetween United States and Europe |
| Finances | 8 | 5 | 0 | Notie |
| Landfilltaxes | 0 | 7 | 3 | Notie |
| JobsCreated | 9 | 6 | 2 | Notie |
| WasteGeneration | 6 | 7 | 0 | Notie |
| WasteComposition | 5 | 5 | 2 | Tiebetween United States and Europe |
| WasteStorage, Collection, and Transportation | 8 | 8 | 3 | Tiebetween United States and Europe |
| EnergyRecovery | 4 | 5 | 4 | Tiebetween United States and Asia |
| EnvironmentalHealth | 5 | 6 | 2 | Notie |
| Total | 51 | 55 | 18 | --- |
As shown in table 2, Europe received the highest overall score with a 55 out of a possible 90. Europe received the highest score in four categories and tied for the highest score with the United States in two categories. The landfill taxes parameter created the largest difference between the United States, which was second with a score of 51 out of 90, and Europe. Europe received a 7 in this category while the United States received a “0”, which helped create the 4-point difference between the two regions in total scores. Asia received the lowest total score: 18 out of 90. Asia received the lowest score in seven categories and tied for the lowest score with the United States in one category. These scores result in a substantial gap between Asia and the other regions that is reflective of the gap between Asia and other regions in real life. The following section includes the justifications for every score each region received.
Main management techniques
United States: The United States used an appropriate amount of all MSW techniques in 2015 [10]. It has been attempting to increase recycling, like Europe, but needs to do a better job decreasing landfilling [11]. In fact, the United States landfilled slightly more than half of its MSW in 2015 [10]. Nonetheless, the United States would fit in as a slightly better than average country in Europe [11]. Therefore, a score of “6” seems to be reasonable to assign in this category.
Europe: Overall, Europe is doing a much better job encouraging different MSWM techniques than discouraging landfilling [11]. While recycling, composting, and energy recovery are important, reducing landfilling is important too [11]. There is one country, Sweden, which sends almost none of its MSW to the landfill [11]. There is another country, Bulgaria that sends nearly all of its MSW to the landfill [11]. Even so, Europe landfilled 41% of its waste in 2014 [12]. Therefore, a score of “7” seems to be reasonable to assign in this category. It is suggested that Europe needs to work bringing its lacking countries to the standards of the thriving ones in the field of MSWM techniques.
Asia: Much of Asia disposes of its MSW through unsafe means, such as open dumping, unsanitary landfilling, and open burning, [13]. The countries that have less of these types of disposal still have a problematic amount of it [13]. The better countries, such as South Korea and China, use an acceptable amount of recycling and WTE techniques [13]. However, because most countries in this region do not have developed MSWM processes, a score of “2” seems to be reasonable to assign in this category.
Finances
United States: Because MSWM, is a business at its core, investors and corporations make up much of the funding in the niche. The United States government provides subsidies for recycling centers which encourages recycling but discourages landfilling. Even so, they fund many landfills to encourage clean practices. However, landfills and waste collection sectors receive most money from tipping fees and user charges. Therefore, because the United States has a stable financial cycle in MSWM that generally discourages landfilling, a score of “8” seems to be reasonable to assign in this category.
Europe: In 2009, European regions spent anywhere from 15 to 225 euros per ton on waste collection, 21 to 250 euros per ton on incineration, and 30 to 164 euros per ton on landfilling [14]. However, as MSW generation naturally increases, the amount of money that enters the system increases as well. Europe has expanded WTE techniques considerably [12]. WTE techniques cost significantly more money than other techniques to sustain [1]. WTE can even undermine Europe’s ability to increase the amount of recycling that they practice [12]. So, even though Europe is providing ample funding into its MSWM, it could spend the money more wisely by investing in recycling and source reduction. Therefore, a score of “5” seems to be reasonable to assign in this category.
Asia: Asia has been investing very little in MSWM overall [15]. The private sector, the community, international funding, and the government should all contribute to MSWM, especially in areas where waste management is poor or nonexistent, like most of Asia [15]. However, the private sector is most pivotal in financing MSWM, as the incentive of profitability drives many of the developments in this niche [15]. However, there are few of these developments from investments [15]. Therefore, a score of “0” seems to be reasonable to assign in this category.
Landfill taxes
United States: Because the government funds many of the landfills in the United States, there are few notable landfill taxes to discourage landfilling [16]. The United States does this through other means, such as subsidies for recycling [16]. But because the United States does not use landfill taxes, a score of “0” seems to be reasonable to assign in this category.
Europe: Many of the countries in Europe utilized some form of landfill tax in 2012, whether it is through a gate fee or just a straight tax [11]. This helped bring an overall decrease in landfilling rates in Europe [11]. However, there are a few countries that do not use a landfill tax [11]. While this is not inherently harmful to the reduction of landfilling, a lack of landfill taxes can still influence it [11]. For example, Germany managed to have one of the highest recycling rates in Europe without the use of landfill taxes, while Bulgaria, which also did not utilize landfill taxes, had one of the highest landfilling rates in Europe [11]. Even so, most countries in Europe attempted to reduce landfilling through the use of landfill taxes, so a score of “7” seems to be reasonable to assign in this category.
Asia: In 2016, an assessment of economic instruments showed that landfill taxes were the second most prioritized method in countries with low MSWM [15]. However, instead of promoting recycling, they inadvertently promoted open dumping to avoid paying money to dispose of MSW [15]. Even though parts of Asia use landfill taxes, they cannot correctly utilize them until they develop MSWM. So, a score of “3” seems to be reasonable to assign in this category.
Jobs created
United States: According to the United States Bureau of Labor Statistics (USBLS), there were 374, 500 jobs related to waste management in the United States in December of 2012. When compared to the 900,000 to 1.5 million jobs related to waste management in Europe as of 2012, it may seem insignificant [12]. But the United States is one country, while Europe is 28 countries, so the number of waste-related jobs in the United States is very notable. Additionally, the United States’ waste-related jobs have been growing steadily over the years, which show that waste-management in the United States growing [17]. Because of this, a score of “9” seems to be reasonable to assign in this category.
Europe: Europe had anywhere from 900,000 to 1.5 million jobs related to waste management in 2012 [12]. Considering that Europe is 28 countries, this number is smaller than it should be because it indicates a smaller waste management sector [12]. However, Europe’s waste management is growing, so therefore, a score of “6” seems to be reasonable to assign in this category.
Asia: As MSWM is in Asia, there is much room for job growth in this field [15]. Because of the underdeveloped waste collection, the lacking practice of safe landfilling, composting, incineration, recycling, and the poor environmental health of Asia, there are many unutilized opportunities for employment [15]. Nonetheless, just waste collection provided around 7,000 jobs in 2007, and a small composting project helped to create 800 more jobs to process compost in 2010 in Dhaka, Bangladesh [15]. But because there are many unutilized opportunities for MSW-related jobs, there are few MSW-related jobs as MSWM in Asia right now, a score of “2” seems to be reasonable to assign in this category.
Waste generation
United States: The United States have shown an overall decrease in MSW generation per capita since 2000, from the peak of 4.74 pounds (2.15 kg) per capita per day to 4.48 pounds (2.03 kg) per capita per day in 2015 [10]. The MSW generation was even lower in 2014, at 4.45 pounds (2.02 kg) per capita per day [10]. Even so, the United States, in 2015, produced the most MSW per person per day of all industrialized nations [18]. Nonetheless, the United States has done a decent job in reducing MSW generation, as a result, a score of “6” seems to be reasonable to assign in this category. Figure 2 below shows the generation rate in the USA from 1960-2015 [18] (Figure 3).
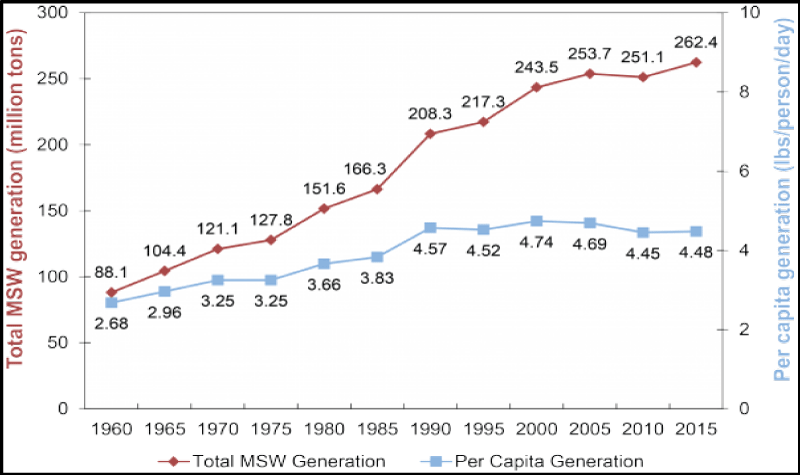
Figure 3: Total and per capita MSW generation in the USA.
Europe: Europe had shown little development in the scope of waste prevention from the years 2001 to 2010 [11]. Twenty-one (21) of the 32 countries showed increased MSW generated per capita over that period [11]. However, Lee, et al. [12], reported a majority trend towards reducing MSW generation per capita for all but nine countries from the years 2005 to 2015. Because of this, a score of “7” seems to be reasonable to assign in this category.
Europe had shown little development in the scope of waste prevention from the years 2001 to 2010 [11]. Almost 21 of the 32 countries showed increased MSW generated per capita over that period [11]. However, Lee, et al. [12], reported a majority trend towards reducing MSW generation per capita for all but nine countries from the years 2005 to 2015. Figure 4 shows the generation rate in the EU for 2016 that varied from 261 to 777 kg/person/year (1.58 to 4.69 lb/capita/day). Average MSW generated per person in 2016 amounted to 480 kg/person (2.90 lb/capita/day), down by 9% compared with its peak of 527 kg per person in 2002, and roughly comparable to the 483 kg recorded in 2015. It should be noted that the reporting of municipal waste differs among Member States and may explain some of the variation in the data.
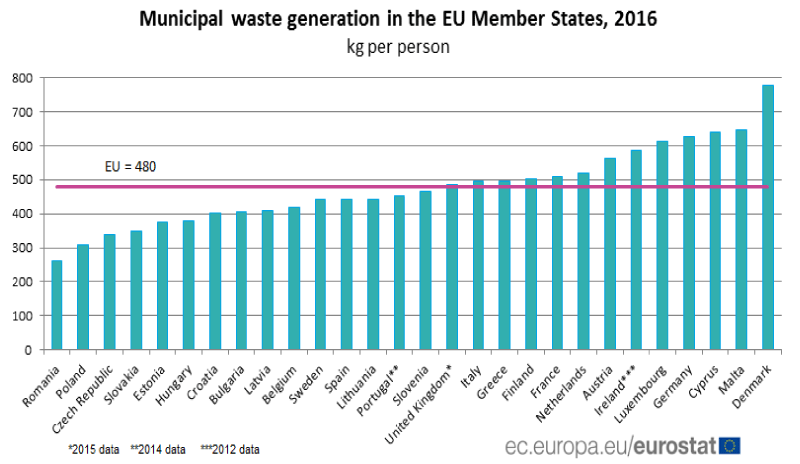
Figure 4: MSW generation in EU1.
Asia: Due to rapid urbanization, widespread industrialization, and significant economic growth in Asia, there has been a notable increase in MSW generation in Asia since 2000 [15]. There has been little effort to improve MSW generation, particularly in the underdeveloped areas of Asia. Therefore, a score of “0” seems to be reasonable to assign in this category.
The amount of solid waste generated in the cities is much higher than in rural areas. The generation rate in rural areas can be as low as 0.15 kg/capita/day, while in the urban areas the rate can be above 1.0 kg/cap/day. The generation rates of major cities reported by the participating member countries are listed in figure 5 [19]. The generation varied from 0.30 to 0.98 kg/capita/day (0.66 to 2.16 lb/capita/day). In the developing countries, waste management is becoming a serious problem as urbanization and economic development increase leading to larger quantities of waste materials [20]. An efficient and robust management of solid waste is needed for forth coming situation.
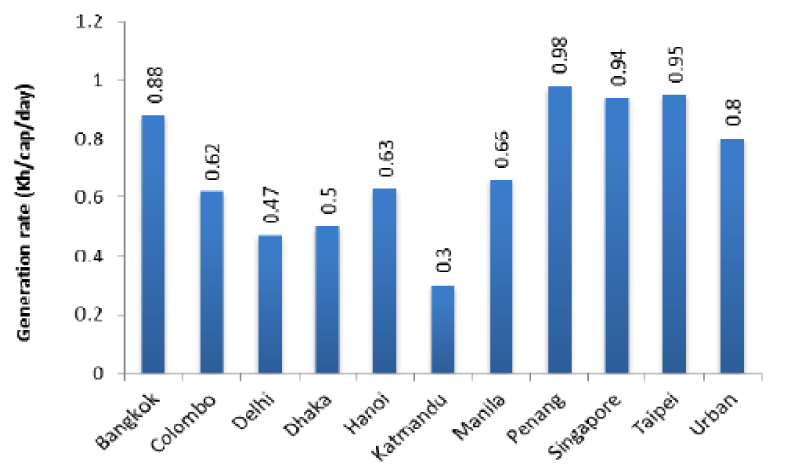
Figure 5: MSW generation in Asia.
Waste composition
United States: Overall, in 2015, the United States used the proper MSWM techniques when considering the MSW composition [10]. For example, a large portion of recycled MSW consists of paper and paperboard, which is the composition of slightly more than a quarter of MSW [21,10]. However, the United States landfills have a problematic amount of recyclable and compostable wastes like paper and food [10]. Therefore, a score of “5” seems to be reasonable to assign in this category. In general, MSW consists of food wastes, paper and paperboard, glass, metals, plastics, rubber and leather, textiles, woods, yard trimmings, and glass. The compositions may vary from region to region. Total MSW generation in 2015 was approximately 262.4 million tons in the USA. Figure 6 [10] shows the breakdown of MSW generation by material. Organic materials such as paper and paperboard, yard trimmings, and food continued to be the largest component of MSW. Paper and paperboard accounted for almost 26 percent, and yard trimmings and food accounted for another 28.4 percent. Plastics comprised about 13 percent of MSW; rubber, leather and textiles accounted for over 9 percent; and metals made up 9 percent. Wood followed at over 6 percent, and glass over 4 percent. Other and miscellaneous inorganic wastes made up more than 3 percent of the MSW generated in 2015.
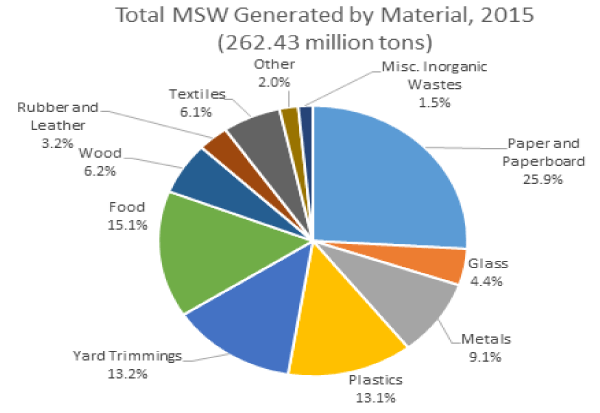
Figure 6: Typical MSW Composition in the USA.
Europe: Like most regions, organic MSW like yard wastes and food wastes, comprise most of the total MSW in Europe, followed by recyclables [22]. Because Europe utilizes WTE techniques and is currently pursuing a drastic growth in recycling, they are simultaneously developing MSWM to be more environmentally preferred and match their waste composition [11]. However, similar to the United States, much of Europe still sends the majority of their MSW to landfills [11]. So, a score of “5” seems to be reasonable to assign in this category.
Figure 7 shows the breakdown of MSW generation by material in Europe, which is not too different from the United States’. As seen in figure 7, currently 80% of the municipal solid waste in Europe is recyclable or compostable. If the eco-design directive is boosted in the way the European Parliament asks for in point 5, it is likely that non-recyclable, non-compostable products by 2020 will be less than 5% of total MSW. Because Europe utilizes WTE techniques and is currently pursuing a drastic growth in recycling, they are simultaneously developing MSWM to be more environmentally friendly and match their waste composition [11]. However, like the United States, much of Europe still sends the majority of their MSW to landfills [11].
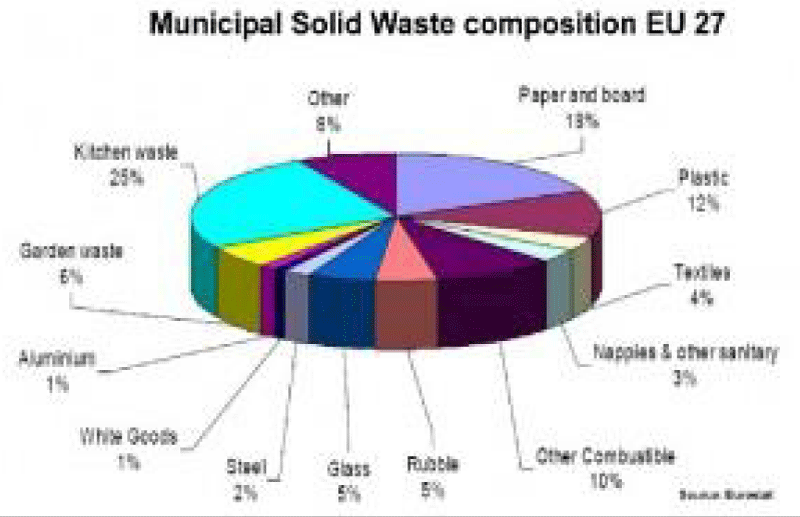
Figure 7: Typical MSW Composition in Europe.
Asia: Most of Asia’s MSW consists of organic materials such as food and lawn clippings [15]. Even so, most of Asia disposes of MSW through open dumping and unsafe landfilling [13]. However, due to the large amount of organic waste, there is an opportunity to develop an efficient composting or WTE system which most of Asia has yet to take advantage of. Composting and WTE are both more environmentally friendly than landfilling and dumping, as well as more beneficial to generate profit and recover energy [23,24]. So, it would be recommended that Asia begins pursuing these processes. Until then, a score of “2” can be assigned in this category.
Figure 8 shows the breakdown of MSW generation by material in Asia which is not too different from the United States’ and Europe’s. Even so, most of Asia disposes of MSW through open dumping and unsafe landfilling [13]. However, due to the large amount of organic waste, there is an opportunity to develop an efficient composting or WTE system which most of Asia has yet to take advantage. Composting and WTE are both more environmentally friendly than landfilling and dumping, as well as more beneficial to generate profit and recover energy [24].
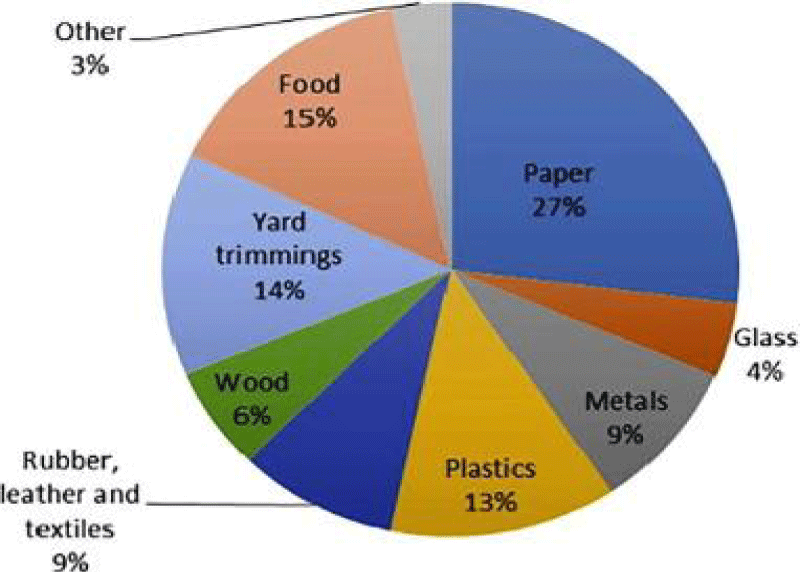
Figure 8: Typical MSW Composition in Asia.
Waste storage, collection and transportation
United States: The United States has had 100% efficiency in waste collection and transportation since 2016 [15]. Additionally, a country’s ability to report accurate waste generation indicates a well-developed waste storage, collection, and transportation system, even if the country does not directly give this data [15]. Because of these reasons, a score of “8” seems to be reasonable to assign in this category.
Europe: Currently, Europe has split into two groups when considering waste storage, collection, and transportation: those that depend upon landfilling as their main MSWM method, and those that depend upon incineration as their main MSWM method [12]. Lee, et al. [12], recommended that the landfilling group begin to develop collection and transportation methods that incorporate sorting the waste. Then, they should expand the recycling method in their region and filter the sorted waste into the appropriate MSWM techniques. For the incineration group, Lee, et al. [12], recommended increasing recycling, managing the energy supply that incineration brings, and focus on waste reduction. The fact that most of Europe is no longer attempting to make their waste storage, collection, and transportation systems more efficient, but instead attempting to make them match more sustainable MSWM techniques is very notable. Therefore, a score of “8” seems to be reasonable to assign in this category.
Asia: Waste collection and storage in the more developed cities of Asia are acceptable and fairly sustainable [15]. In less developed cities such as Dhaka, Bangladesh, waste collection consists of sweeping waste off the streets and scooping it out of the rivers [15]. Additionally, waste transportation efficiency is approximately 43% in Dhaka [15]. As a result, there are many potential jobs in waste collection in Asia. So, it was strongly recommended that local authorities and the community strive for waste collection and transportation growth. Because much of Asia does not practice waste storage, collection, and transportation well, a score of “3” seems to be reasonable to assign in this category.
Energy recovery
United States: In 2015, the United States managed 34 million tons of MSW through combustion with energy recovery, which amounts to 12.8% of its total generated waste [10]. When compared to Europe, this is fairly low as 10 countries in Europe in 2010 incinerated greater than 25% of their total generated waste [11]. In total, Europe incinerated around 55 million tons of MSW, which is more than the United States’ 34 million tons in 2015, which is a later date [10,11]. As time goes on, economies, populations, and MSWM grow, so the amount of MSW Europe incinerated is likely to have gone up by 2015 [10]. Therefore, a score of “4” seems to be reasonable to assign in this category.
Europe: Even of the countries in the European Union incinerated more than 30% of their total MSW with energy recovery [12]. While this rate is very high, there are many countries in the European Union that landfill as much as others incinerate with energy recovery [11]. So, a score of “5” seems to be reasonable to assign in this category.
Asia: Due to high costs and generally high moisture content in generated wastes, energy recovery from waste in low-income countries may not be practical [15]. However, certain countries with higher incomes such as China or Japan have made effective use of WTE technologies [15]. In 2013, Japan produced a total of 1,130.1 million kWh of energy [15]. The use of WTE technologies has allowed for beneficial energy recovery in developed areas of Asia, but the underdeveloped areas are lacking still [1,15]. Therefore, a score of “4” seems to be reasonable to assign in this category.
Environmental health
United States: For much of the history of landfilling, particularly in the United States, MSW deposited directly into the ground decreased the environmental quality and cleanliness of the ground and groundwater in the surrounding areas [18]. Then, in an attempt to reduce the volume of landfilled materials, open burning became common practice [18]. However, this contributed a notable amount to the decrease of the quality of urban air [18]. So, the United States Government created the Resource Conservation and Recovery Act (RCRA) in 1976, which began to regulate MSWM practices such as landfilling [18]. Even though the landfills from before 1976, which were active before the United States put the RCRA into place, created contaminated areas of land, the United States began to improve the environmental safety of landfilling [18]. Today, landfilling is a cleaner practice, even to the point of capturing and controlling the methane gas produced from decomposing waste [25]. However, landfilling is the least environmentally preferred MSWM method [24]. The United States disposes the majority of its MSW in landfills [10]. Therefore, a score of “5” seems to be reasonable to assign in this category.
Europe: Europe mainly utilizes landfilling to dispose of MSW. However, there has been a major push to promote recycling throughout all of the European Union, which will only help their already environmentally clean society become even cleaner [12]. Because of this, a score of “6” seems to be reasonable to assign in this category.
Asia: Because Asia has such a prevalent presence of open burning, open dumping, and the like, they have a considerable amount of pollutants entering the environment through the form of emissions in the air, water, and soil [13]. This issue has been happening for a long time, and, even though it has been very slowly improving, therefore, a score of “2” seems to be reasonable to assign in this category.
Evaluation of findings
There were a few problems with the data collection. First, when sampling sources, it was very difficult to find sources that discussed the information needed for the decision matrix. Around the world, and Asia especially, there are few sources that give information about MSWM at all, let alone information that is accurate [15]. It is very possible that a few of the sources used for the decision matrix were like this. However, most of the gathered information was from reputable sources, such as the USEPA, the EEA, and the United Nations. Additionally, the information from the other sources was compared to these reputable ones to check that they were not too inaccurate. Nonetheless, the accuracy of the sampled sources decreases the validity of the findings slightly [26].
Second, decision matrices are inherently subjective. To counter this, all of the scores were justified that were awarded to the regions. This allows for accuracy within a few points. However, even a few points for every parameter would be enough to sway the total score differently from the scores in this study. So, if another person with slightly different opinions than that of the authors were to conduct this study again, the United States could get a higher score than Europe. Therefore, the reliability of the findings decreases slightly [27].
Finally, because the sources are all from slightly different times, the information that was gathered cannot be put together completely. For example, it is incorrect to compare total waste generation of the United States in 2009 to the total waste generation of Europe in 2018 because technology has gotten more advanced, populations have increased, and there have been advances to reduce waste generation in the last ten years [10,11]. However, the sources were close enough together that that helped draw general trends and comparisons, which is mostly what was done in this study. Therefore, the validity of this study seems to decrease slightly.
Even though these issues were experienced, the study is still reliable and valid due to the strengths of decision matrices and meta-analyses [28,29]. Meta-analyses combine information from many sources to increase the power of the gathered information, as well as to allow researchers to apply their research to a great population [28]. In this way, this study was broadened to a systemic context rather than a smaller one. Additionally, decision matrices work to rank options based off of multiple criteria, which allows researchers to broaden their study to include more variables [7]. In this way, many variables were analyzed in a large scope to be justified and as accurate as possible. Further, a decision matrix allowed the study to examine collected data in such a way that quantitative and qualitative data can be combined and converted into ordinal, qualitative points (between zero and ten) with which a calculated decision can be made as to which region has the best MSWM methods [29]. This method of decision making aligns with the multi attribute value theory (MAVT), which is one of the main types of decision matrices [7].
This study aimed to compare the MSWM systems of three large regions using a decision matrix with sampled sources from a meta-analysis. This research design allowed for compiling information from many sources to increase accuracy of the data in the justifications for the decision matrix. This study was accomplished through the utilization of purposive sampling to select and evaluate sources that discuss solid waste management and comparing the processes to discern which is the most favorable in many parameters [30-33]. Nine parameters such as main management techniques; finances; landfill taxes; jobs created; waste generation; waste composition; waste storage, collection, and transportation; energy recovery; and environmental Health were used with a scoring scale of zero to 10 to populate the decision matrix. Europe had the best municipal solid waste management with a score of 55 out of 90 according to the specified parameters. The United States had the second highest score (51 out of 90) and Asia had the lowest score (18 out of 90). The final score from the decision matrix suggests that Europe has the most favorable MSWM system, though the United States is not much worse than Europe.
Because of the many limitations observed in this study, more future studies are necessary with more focused analysis. This way, a study can be thorough and sound, while still impactful. Also, it is recommended that researchers conduct future studies on areas that delimited out of this one, such as Africa, Australia, and South America. There are many similar issues happening in some of those places as in Asia, so it is imperative that those regions are examined. One could even replicate this study with those regions instead. The suggestions would be to follow MSWM practices from the United States gradually to some extent with relaxation as necessary to start with until an infrastructure is set, and an economic viability is achieved.
- Cheng H, Hu Y. Municipal solid waste (MSW) as a renewable source of energy: Current and future practices in China. Bioresour Technol. 2010; 101: 3816-3824. PubMed: https://www.ncbi.nlm.nih.gov/pubmed/20137912
- Manaf LA, Samah MA, Zukki NI. Municipal solid waste management in Malaysia: Practices and challenges. Waste Manag. 2009; 29: 2902-2906. PubMed: https://www.ncbi.nlm.nih.gov/pubmed/19540745
- Sharholy M, Ahmad K, Mahmood G, Trivedi RC. Municipal solid waste management in Indian cities – A review. Waste Manag. 2008; 28: 459-467. PubMed: https://www.ncbi.nlm.nih.gov/pubmed/17433664
- Islam MS, Sultana A, Rasheduzzaman M, Kundu GK, Kamal AKI, et al. Assessment of the present state and economical prospects of solid waste at Amin Bazar waste dumping site, Dhaka, Bangladesh. J Sci Res. 2015; 7: 129-137.
- Laerd Dissertation. Purposive sampling. 2019.
- Laerd Statistics. Types of Variable. 2019.
- Kiker GA, Bridges TS, Varghese A, Seager PT, Linkov I. Application of multicriteria decision analysis in environmental decision making. Integr Environ Assess Manag. 2005; 1: 95-108. PubMed: https://www.ncbi.nlm.nih.gov/pubmed/16639891
- Przydatek G. A comparative analysis of municipal waste management systems. Polish Journal of Environmental Studies. 2016; 25: 2107-2112.
- Hazra T, Goel S. Solid waste management in Kolkata, India: Practices and challenges. Waste Manag. 2009; 29: 470-478. PubMed: https://www.ncbi.nlm.nih.gov/pubmed/18434129
- United States Environmental Protection Agency (USEPA). Advancing sustainable materials management: 2015 fact sheet. 2018b.
- European Environment Agency (EEA). Managing municipal solid waste- A review of achievements in 32 European countries. 2013.
- Lee P, Sims E, Bertham O, Symington H, Bell N, et al. Towards a circular economy- Waste management in the EU. 2017.
- Yadav P, Samadder SR. Environmental impact assessment of municipal solid waste management options using life cycle assessment: A case study. Environ Sci Pollut Res Int. 2018; 25: 838-854. PubMed: https://www.ncbi.nlm.nih.gov/pubmed/29063409
- Scortar LM. Study on the financing of the municipal waste management. Managerial Challenges of the Contemporary Society. 9: 106-109.
- Modak P, Pariatamby A, Seadon J, Bhada-Tata P, Borongan G, et al. Asia waste management outlook. 2017.
- United States Environmental Protection Agency. (USEPA). Economics of waste management and land cleanup. 2018a.
- United States Bureau of Labor Statistics (USBLS). Waste management and remediation services: NAICS 562. 2019.
- United States Environmental Protection Agency (USEPA). Municipal solid waste landfills. 2018d.
- Islam FAS. Solid Waste Management System in Dhaka City of Bangladesh. J Modern Sci Technol. 2016; 4; 192–209.
- Hannan MA, Arebey M, Basri H, Begum RA. Intelligent Solid Waste Bin Monitoring and Management System. Australian Journal of Basic and Applied Sciences. 2010; 4: 5314-5319.
- United States Environmental Protection Agency (USEPA). Advancing sustainable materials management: 2016 recycling economic information (REI) report. 2016.
- Bidlingmaier W, Sidaine J, Papadimitriou EK. Separate collection and biological waste treatment in the European Community. 2004.
- Karim MA, Corazzini B. The current status of MSW disposal and energy production: a brief review of waste incineration. MOJ Eco Environ Sci. 2019; 4: 34‒37.
- United States Environmental Protection Agency (USEPA). Sustainable materials management: Non-hazardous material and waste management hierarchy. 2017.
- United States Environmental Protection Agency (USEPA). Municipal solid waste landfills. 2018c.
- Colorado State University. Validity. 2019b.
- Colorado State University. Reliability. 2019a.
- Himmelfarb Health Sciences Library. Study design 101: Meta-analysis. 2011.
- Pamučar D, Božanić D, Ranđelović A. Multi-criteria decision making: An example of sensitivity analysis. Serbian Journal of Management. 2017; 12: 1-27.
- Central Intelligence Agency (CIA). The world factbook: United States. 2019a.
- Central Intelligence Agency (CIA). The world factbook: European Union. 2019b.
- International Monetary Fund (IMF). Gross Domestic Product (GDP). 2019.
- Worldatlas. Asia. 2019.