Research Article
Wave Forces on Vertical Structures in Shallow Water: Numerical Evaluation

Fabio Dentale1,2*, Ferdinando Reale1, Angela Di Leo1, Eugenio Pugliese Carratelli1,2 and Marina Monaco2
1University of Salerno-MEDUS (Maritime Engineering Division University of Salerno), Department of Civil Engineering-Via Giovanni Paolo II, 132-Fisciano (SA), Italy
2CUGRI (University Consortium for Research on Major Hazards), Via Giovanni Paolo II, 132-Fisciano (SA), Italy
*Address for Correspondence: Fabio Dentale, University of Salerno-MEDUS (Maritime Engineering Division University of Salerno), Department of Civil Engineering-Via Giovanni Paolo II, 132-Fisciano (SA), Italy, Email: [email protected]
Dates: Submitted: 04 March 2017; Approved: 30 March 2017; Published: 31 March 2017
How to cite this article: Dentale F, Reale F, Di Leo A, Carratelli EP, Monaco M. Wave Forces on Vertical Structures in Shallow Water: Numerical Evaluation. Ann Civil Environ Eng. 2017; 1: 020-033.
DOI: 10.29328/journal.acee.1001003
Copyright License: © 2017 Dentale F, et al. This is an open access article distributed under the Creative Commons Attribution License, which permits unrestricted use, distribution, and reproduction in any medium, provided the original work is properly cited.
Keywords: Volume of fluid; Wave forces; Numerical simulations; Reynolds averaged navier-stokes equations

ABSTRACT
The actions exerted by waves on a coastal structure very much depend upon hydrodynamic processes that originate on shallow waters; even though significant progresses have been made in the last few years towards a full understanding of wave breaking, design work is still largely based on classical stability formulas. The recent availability of reliable models based on the numerical integration of full Navier-Stokes equations provides an important tool, but the evaluation of forces on vertical structures in shallow waters is still a particularly delicate application because of the complex hydrodynamic issues involved.
The paper presents deals with the numerical simulation of wave effects on front of a vertical obstacle on a sloping bottom, with the objective of clarifying some physical issues which are relevant towards the applicability of numerical Navier-Stokes simulation as a design tool.
INTRODUCTION
The argument addressed here is the effect of wave breaking on the hydrodynamic loads on structures based on shallow water. The difference between breaking and non-breaking waves is crucial in many aspects of the design of coastal works; such a difference is highlighted in some empirical formulas, but until recently it still lied undetected in engineering practice. The estimation of wave forces on breakwater is an important topic, because it is fundamental to design the structures. The value of these forces, in many cases with wave breaking condition are generated actions that lead to the collapse of materials. To reduce these effects the scientists are studying new approaches and new materials [1].
A clear picture of the effects of wave impacts on vertical wall derives from the PROVERBS group [2] work in the late 90s. Semi-empirical methods [3-6] provide a phase-averaged description of wave transformation on shallow bottom, yielding the variation of the wave height, and sometimes the setup in the surf zone; quantities such as the wave celerity, the radiation stress and the energy flux are, if necessary, modelled by making use of sinusoidal wave theory results. Pressures and forces on the structure are then calculated with formulas such as [3], making use of the wave height values provided by the previously mentioned methods. The underlying assumption is that wave height thus calculated can be safely used as input to formulas which were originally derived from experiments carried with non-breaking waves.
A weakness of such methods is that wave height in presence of a structure is bound to be modified by the presence of the structure itself, so it is somewhat arbitrary to assume values provided by run-up experiments on open slopes. Criteria for wave breaking in front of a vertical wall have been developed [7], but their applications are far from universal.
The situation is changing thanks to recent developments in the numerical simulation techniques of wave dynamics, which are now an efficient tool to directly enquire into the parameters that are of interest to the design of coastal structures. Numerical Navier Stokes models, integrated with turbulence modelling and with volume-of-fluid surface tracing algorithms (in the following referred to as RANS/VOF), can provide a 2D direct computation of relevant quantities in near-shore hydrodynamics (i.e., energy flux, momentum flux), and extensions to 3D may well be a possibility in the near future; a detailed picture of free-surface elevation, pressure and velocity field within the surf zone is thus now practically available.
RANS/VOF methods (Reynolds Averaged Navier-Stokes equation/Volume of fluid), were first developed by [8], and have now evolved into a fully reliable technique [9]; by far the most commonly RANS/VOF software systems for this kind of calculation are FLOW-3D, produced by Flow Science [10] and COBRAS (COrnell BReaking waves And Structures)-originally developed by [8] at Cornell University. For instance [11-14] have used the former, while Losada and co-workers have been using the latter extensively; in particular [15] considered the wave overtopping on a gravity caisson with installed on a rubble-mound foundation. [16], uses a different code developed at Danish Hydraulic Institute (DHI). An extensive, though not completely up to date, review of existing RANS/VOF techniques applied to wave breaking is reported on [17,18], while a full discussion of the turbulence simulation aspects can be found in [19].
Innovative Lagrangian Smoothed particle hydrodynamics (SPH) methods are quickly evolving, and it is possible that they will be eventually able to compete with Eulerian methods [20,21], even though at present there is not yet enough available experience to support their application to real wave action problems [22].
METHODOLOGY
The paper presents some results of numerically simulation experiments on wave breaking effects in front of a schematic vertical obstacle based on shallow water on a sloping bottom. Its main objective is to clarify some hydrodynamic issues which are relevant towards design procedures, rather than to provide results towards a specific application; the tests were therefore carried out with simple sinusoidal wave trains rather than with empirical wave spectra since some hydrodynamic and numerical effects can be hidden by the pseudo-random nature of the spectral wave generation, which introduces a further element of incertitude in the computed results.
The computational geometry is a rather typical 2D wave configuration, and it follows a standard set up for this kind of studies: a 2 dimensional domain extending for a total of 280 meters-a 70m long stretch of horizontal bottom canal followed by a flat 1/20 slope figure 1.
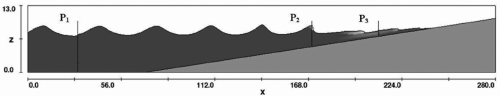
Figure 1: Numerical set-up.
A target structure is schematized as a straight vertical wall, founded on depth ds; a sinusoidal wave generator is located on the left end side of the channel, providing a Stokes 1st order (Airy) wave orbital velocity and water height input, with wave height H and period T.
FLOW-3D software was employed, with various grid sizes and time steps and a standard k-ε turbulence model was used for most of the computations; RNG (Re-Normalisation Group) method was also occasionally tested to verify the consistence of results.
Grid resolution is possibly the most important numerical parameter, as it critically affect the results and requires a trade-off between accuracy and computational effort. A compressible fluid approach is taken, with a realistic coefficient for water as it is necessary since compressibility might play a role in some conditions; time steps must therefore automatically adjusted during the computation in order to satisfy the stability constraints, thus leading to rather long computational times.
The size of the spatial mesh is an important issue, and some results of a mesh convergence analysis are shown in the following. Wave parameters at the generator were: H=2 m (wave height) and T=4.8 s (wave period); roughness parameter in the bottom wall function was set to 0 (smooth wall).
There seems to be a good coincidence between the finer and the medium grid (Figure 2); so, in the trade-off between accuracy and computational effort, the Medium Grid is the best option, and square cells of 0.10 m sides can be accepted. Even in the constant depth zone, where the flow field can be expected to be rather regular, too coarse a grid can lead to a remarkable underestimation of the peak height; in the example shown above, with a wave length of about 33 meters, the three different mesh sizes imply respectively 165, 330 and 660 points for each wave. Similar tests have to be carried out for each computational experiment.
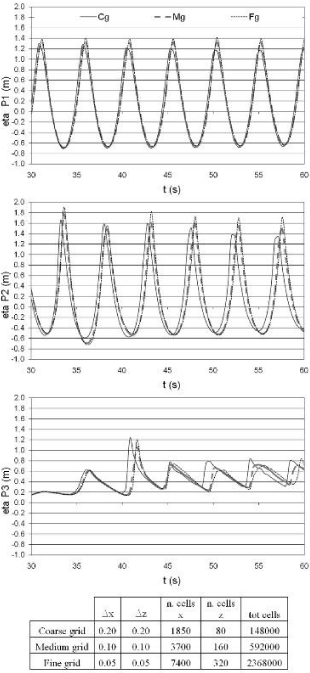
Figure 2: Comparison between wave height at different grid size: coarser grid, medium grid, finer grid.
Testing and calibration of RANS/VOF against experimental results on such a complex system are a prerequisite; a number of tests were thus run by making use of the numerical set up as in figure 1. Figure 3 summarises the results of the comparison between published experimental data [23-25] and the simulated [26-29], wave heights in various probes located along the submerged slope on both the constant depth zone and the breaking zone.
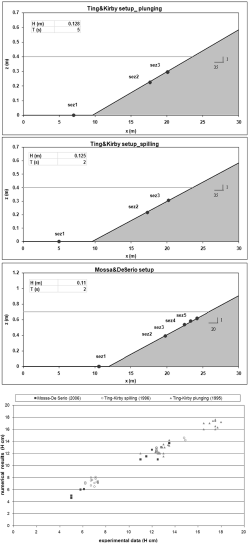
Figure 3: Correlation between numerical and experimental wave heights at different probes.
Also the instantaneous water height η(t) can be verified against laboratory tests: Figure 4 shows a comparison with [30].
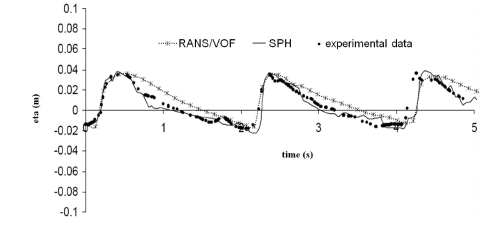
Figure 4: Instantaneous water height η, form experimental data, FLOW-3D numerical results and 2D SPH [30].
The peak η(t) values are well reproduced, even if SPH (Smoothed particle hydrodynamics) seems to provide a better performance for the overall behavior; it is worth noticing, however, that the SPH results presented above were produced within a work aimed at testing and optimizing the effects of various viscosity formulations on a specific set of ad-hoc experiments, while the present RANS/VOF calculations are not calibrated for any particular problem. SPH does not seem to be yet fully mature for this kind of applications [22].
Scale effects
When considering RANS/VOF calibration against laboratory or field experiments, it is important to note that most of the published results are carried out at a rather small scale, or at prototype scale with low wave heights, thus implying low Reynolds numbers and presumably a comparatively low level of turbulence. Numerical modelling is also often performed at a reduced length scale, mainly because numerical viscosity effects decrease with the mesh size.
However, independence from scale is not a trivial assumption since, as the physical dimensions go up (higher Re) the influence of viscosity decreases while the turbulence effects increase. A detailed numerical analysis was undertaken (Figure 5) by considering the comparative effects of molecular and simulated eddy viscosity at different scales; the rationale behind small scale modelling breaking is thus found to be correct since, at least for spilling waves, important parameters are not influenced by the size. However, if no additional damping effects are considered (i.e., if a standard high Reynolds turbulence model is used) the damping out of turbulence as the scale goes further down cannot be properly reproduced. Thus, while no final conclusion can be reached about the lowest admissible limit, it can be safely assumed that length ratios as low as 1/40 can still provide reliable results. This is consistent with [21] results, which show the relatively low importance of turbulence effects on water height.
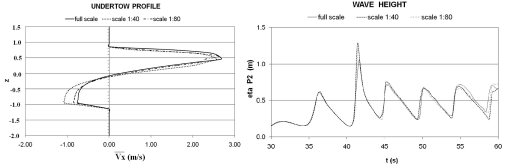
Figure 5: Undertow vertical profile and wave height time history in probe P3.
Wave breaking on a sloping beach
Before the actual impact of a breaking wave is examined, it is useful to reconsider the behaviour of the wave as it evolves, breaks and reforms along the slope when no obstacle is present. The commonly accepted parameter is the local wave height, easily computed as standard deviation ση, of the instantaneous water height η, (trivially ση=H/√8 for sinusoidal waves, Hs/4 for random waves); it is also useful to consider the momentum flux Fqdm transported by the wave as a significant parameter associated with wave intensity.
In which:
d=depth
η=instantaneous water height
p=pressure
ρ=water density
u=velocity
For a regular wave train, the breaking and the successive reforming take place in a well-defined number of points. The wave height trend is therefore step-shaped, with leaps localized in the points where breaking conditions are reached. This provides a better understanding of breaking processes, by appropriately selecting the measuring probes. Figure 6 shows how a typical RANS/VOF simulation of a spilling wave.
In the figure 7, the time behaviour of Fqdm and of its kinetic part Fqk is shown at the three probes P1, P2 and P3, (as reported in figure1), for a sine wave input train with H=2 m and T=4.8 s. The first probe, P1, is in the constant depth zone (d=8 m) where the waves are still sinusoidal; Fqdm fluctuations for both the numerically simulated wave and an Airy wave of the same height are practically the same. It also interesting to see that the kinetic term Fqk is relatively small so that the most important term of the momentum flux is the pressure. For breaking waves (P2) and post-breaking or reforming waves (P3) the difference between the parameters for numerically simulated wave and those calculated according to the linear wave theory is much more important. Also, for breaking and regenerating waves the kinetic term becomes the most important one in the momentum flux. For the breaking wave in P2, the ratio between the numerically simulated momentum flux and the same quantity evaluated for an Airy wave of the same zero up crossing height would be about 1.50. The same parameter rises to 2 for post-breaking wave in P3.
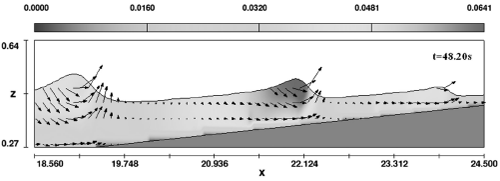
Figure 6: Velocity (arrows-[m/s]) and turbulence (colour scale-[m2/s2]) intensity from RANS/VOF numerical simulations.
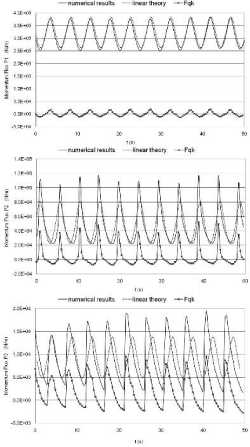
Figure 7: Momentum flux time history in probe P1, P2 and P3.
The same simulations are then repeated for different wave heights: in the following regular waves with different heights are considered at the three probes.
At probe P1 the differences in both water height and momentum flux between the waves are obvious (Figure 8a). Moving along the slope, the higher wave train reaches probe P2 after its breaking point, while the lower one (H=2 m) has not dissipated any energy yet (Figure 8b), so their local wave heights and momentum fluxes are similar. The average water level (set up) is of course higher-as it was to be expected.
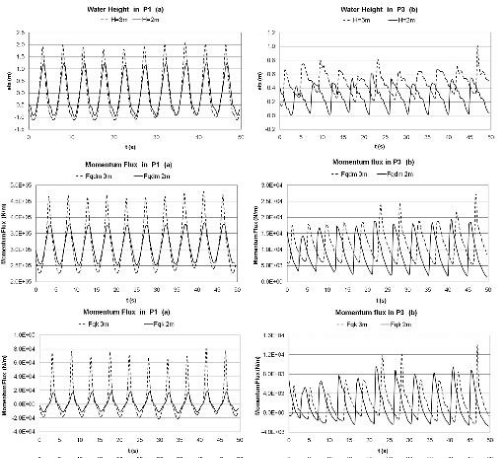
Figure 8: Water height and momentum flux time histories in probe P1 (a) and P3 (b) for different H.
Results shown so far suggest that, while for non-breaking waves the linear theory provides acceptable estimates of the momentum flux and therefore possibly of the wave forces that would be exercised on a structure, for breaking and post-breaking waves the linear theory would strongly underestimate such a parameter.
Wave actions on a vertical wall
According to the above mentioned PROVERBS programme (for instance, [2]), as well as to some earlier work, such as the paper by [31], a distinction has to be made between the (perhaps inappropriately) so called quasi-static and impact (also called slamming) loads. Quasi-static force varies in time in accordance to the water surface elevation and can be adequately interpreted under the incompressible flow assumptions, while the slamming force can be either due to velocity components brought to a sudden stop by a normal solid wall or to the formation of a jet like slipping flow (“flip-through.”, [32,33]), without any actual impact on the wall.
Slamming pressures Ps, in principle, can reach very high values, but their duration is generally very small, linked as it is to the elastic wave propagation time, and therefore to the fluid sound speed C. If Dy is the length involved in the normal impact, the typical slamming force would thus be Ps Dy2, and its duration Ts=Dy/C, i.e. generally high and very short in comparison with quasi-static loads. Such short duration impulses appear to be random in numerical experiments as well as in practice, thus reflecting high sensitivity to physical conditions as well as to computational parameters. Figure 9 provides an example of the slamming pressure computed at the average sea level.
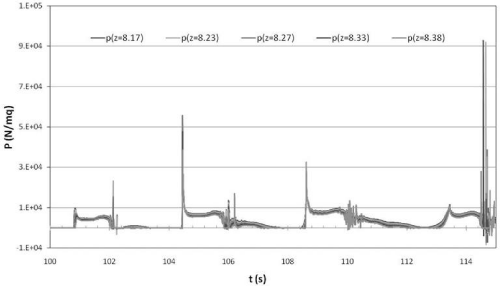
Figure 9: Typical slamming pressure as computed by RANS/VOF.
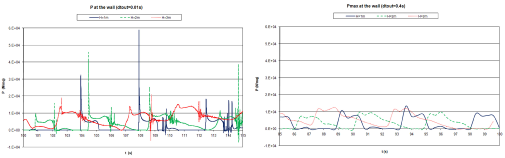
Figure 10: Effect of sampling interval dtout on RNAS/VOF computed pressures a) dtout=0.01s; b) dtout=0.4s.
The qualitative agreement with many experimental tests is obvious, as the typical “church roof” behavior is well reproduced; numerical modelling techniques based on RANS/VOF would in principle be well suited to carry out this kind of analyses, since fluid compressibility is taken into account and computational steps are normally small enough. However, a different approach to the numerical experiments would be required in order to estimate the appropriate statistics, and this aspect is outside the scope of this work.
In order to exclude impact loads, the time resolution of the output can be lowered: as shown in figure 10, a smoother diagram is obtained by lowering sampling interval, even though occasional short duration peaks can still be seen.
Wave breaking effects on a slope and their relevance to wave actions on the wall have been analyzed by considering a schematic vertical wall founded at depth ds on the previously considered sloping beach; two locations and therefore two different values for ds are considered: the first one (scheme A) by locating the wall at a distance of 170m from the wave generator (former position of probe P2) and the second (scheme B) at 210m (formerly probe P3). In the second example waves break at about abscissa 192, while in the first no breaking takes place before the wall: Figure 11 reports results for water height and momentum flux at the wall.
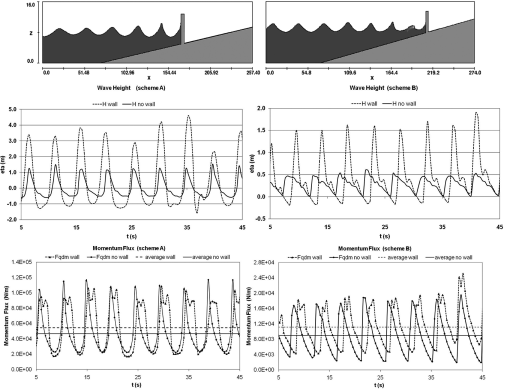
Figure 11: Numerical set-up with schematic structure, water heights and momentum fluxes at the wall as function of time: left-scheme A; right-scheme B.
As it was to be expected, the wave height is much greater when the wall is present, because of the reflection effects; it is remarkable however that the momentum flux (inclusive of the static pressure) does not change substantially. A clearer picture can be obtained by plotting the pressure at the wall over the whole water height for a whole period (Figure 12).
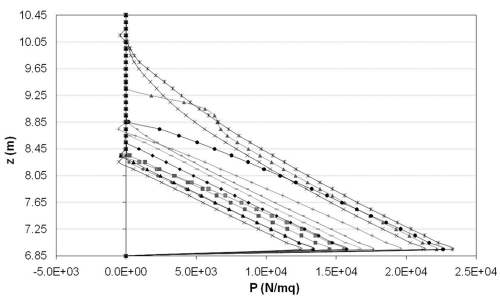
Figure 12: Pressure vertical profile at the wall (H=3m; T=4.8s) plotted at 0.48s intervals.
The same calculations were carried out for different input waves in order to evaluate the influence of the offshore wave height as well as the effects of the wave breaking.
Figure 13 reports resulting water height oscillations and momentum fluxes (which coincide with horizontal forces) at the wall for scheme B and for the following wave parameters: H=1, 2, 3, and 4 m, T=4.8 and 10 s.
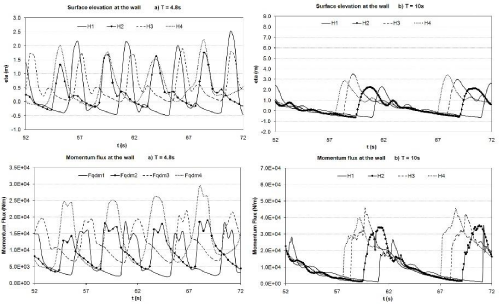
Figure 13: Pressure vertical profile at the wall (H=3m; T=4.8s) plotted at 0.48s intervals.
It is interesting to note that the lowest wave (H=1 m) yields a higher water height as well as higher total force than the H=2 wave, which breaks before the wall; increasing wave heights, however, yield increasing forces
Very few-if any-Numerical RANS/VOF are available for wave forces on vertical structures in shallow water; the most complete numerical solution for a similar, but geometrically more complex, problem are presented in the already quoted paper by [15], where the main emphasis is on wave run-up rather than on forces or pressures.
In the following a comparison is made with the semi-empirical methods mentioned above; in particular pressures and forces were computed with the Goda procedure mentioned above and referred to as GG. (Figure 14).
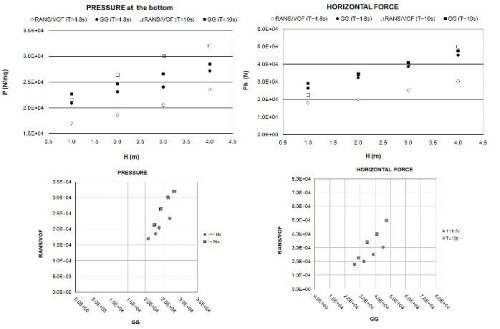
Figure 14: Pressure and forces at the wall for different wave heights (H=1-2-3-4m) and periods (T=10s; T=4.8s) RANS/VOF (average over a few waves) vs. GG procedure.
The general trend for pressure is well reflected, even though computed values tend to stay below GG for short wave periods while they seem to be higher for longer waves. Same applies to global forces, where a good fit is obtained for the lower period, while again for longer waves RANS/VOF results considerably exceed GG values.
As it is well known from traditional procedures and engineering practice, a constant value is reached, depending on the basement depth. This is only true, however, when the bottom slope is slight enough, so in our 1/20 slope examples the wave actions depend on offshore wave height, as it can be seen by plotting the results.
This seem to suggest that RANS/VOF provides, for a vertical structure in shallow water, results that are comparable with empirical formulas; the flexibility deriving from numerical simulation provides thus an important design tool for situations where wave breaking on shallow water and reflection from vertical structure interact with each other.
CONCLUSIONS
A number of useful results have been obtained by numerically modelling breaking wave action a vertical structure on shallow water on a sloping bottom. Such a configuration, while largely diffused in practise, had not been tackled before with up to date numerical integration of full Navier-Stokes with Volume of Fluid surface tracking.
It has been shown that such modelling can be carried out on a small spatial scale since-at least for spilling waves-relevant hydrodynamic parameters are not influenced by the scale; this allows numerical and practical advantages.
Results for pressure and force on the structure are comparable to those provide by existing and well proven empirical methods, while at the same time allowing the flexibility deriving from numerical simulation. RANS/VOF has thus proven to be an important design tool for structures in shallow water.
REFERENCES
- Spadea S, Farina I, Berardi VP, Dentale F, Fraternali F. Energy dissipation capacity of concretes reinforced with recycled PET fibers. Ingegneria Sismica. 2014; 31: 61-70. Ref.: https://goo.gl/9Ok7yr
- Oumeraci H, Kortenhaus A, Allsop W, De Groot M, Crouch R, et al. Probabilistic Design Tools for Vertical Breakwaters. GPB Gorter by Steenwijk. The Netherlands. 2001.
- Goda Y. Random seas and design of maritime structures. University of Tokyo press, Tokyo. 1985.
- Kamphuis JW. Wave Height from Deepwater through Breaking Zone. J of Waterway, Port, Coastal, and Ocean Engineering. 1994; 120: 347-367. Ref.: https://goo.gl/ElZhJT
- Müller G, Whittaker TJT. Evaluation of design wave impact pressures. J of Waterway, Port, Coastal, and Ocean Engineering. 1996; 122: 55-58. Ref.: https://goo.gl/hqQwMi
- Kobayashi N, Meigs LE, Ota T, Melby JA. Irregular Breaking Wave Transmission over Submerged Porous Breakwater. J of Waterway, Port, Coastal, and Ocean Engineering. 2007; 133: 104-116. Ref.: https://goo.gl/oRMpHA
- Calabrese M. Onset of breaking in front of vertical and composite breakwaters. Proceedings 2nd Task 1 Workshop, MAST III, PROVERBS-Project: Probabilistic Design Tools for Vertical Breakwaters, Edinburgh, UK, 1997; Annex 1.0.4.
- Lin P, Liu PLF. A numerical study of breaking waves in the surf zone. J Fluid Mechanics. 1998; 359: 239-264. Ref.: https://goo.gl/DwtQQM
- Giarrusso CC, Dentale F, Pugliese Carratelli E. On the stability of protected beaches. Sixth International Conference on Computer Modelling and Experimental Measurement of Seas and Coastal Regions, Coastal Engineering VI, Cadiz, Spain, 2003.
- Bradford SF. Numerical simulations of surf zone dynamics. J of Waterway, Port, Coastal, and Ocean Engineering. 2000; 126: 1-13.
- Neves MG, Reis MT, Losada IJ, Hu K. Wave Overtopping of Póvoa de Varzim Breakwater: Physical and Numerical Simulations. J of Waterway, Port, Coastal, and Ocean Engineering. 2008; 134: 226-236. Ref.: https://goo.gl/GWKzuH
- Chopakatla SC, Lippmann TC, Richardson JE. Field verification of a computational fluid dynamics model for wave transformation and breaking in the surf zone. J of Waterway, Port, Coastal, and Ocean Engineering. 2008; 134: 71-80. Ref.: https://goo.gl/lv7dwF
- Mo W, Liu PLF. Three dimensional numerical simulations for non-breaking solitary wave interacting with a group of slender vertical cylinders. International Journal of Naval Architecture and Ocean Engineering. 2009; 1: 20-28. Ref.: https://goo.gl/yDv1la
- Yang IJ, Lee YG, Jeong KL. Numerical simulation of the free surface around a circular column in regular waves using modified marker-density method. International Journal of Naval Architecture and Ocean Engineering. 2015; 7: 610-625. Ref.: https://goo.gl/H8l1tr
- Lara JL, Losada IJ, Guanche R. Wave interaction with low-mound breakwaters using a RANS model. Ocean Engineering. 2008; 35: 1388-1400. Ref.: https://goo.gl/nFxfg5
- Christensen ED. Large eddy simulation of spilling and plunging breakers. Coastal Engineering. 2006; 53: 463-485. Ref.: https://goo.gl/3KWIZ6
- Dentale F, Donnarumma G, Pugliese Carratelli E. Rubble Mound Breakwater: Run-up, Reflection and Overtopping by Numerical 3D Simulation. 10th Coasts, Marine Structures and Breakwaters Conference 2013: From Sea to Shore-Meeting the Challenges of the Sea. 2014; 2: 1164-1173.
- Brown CT, Dentale F. Variable distribution of armour on seawalls and breakwaters. 10th Coasts, Marine Structures and Breakwaters Conference 2013: From Sea to Shore-Meeting the Challenges of the Sea. 2014; 1: 149-154.
- Zhao Q, Armfield S, Tanimoto K. Numerical simulation of breaking waves by a multi-scale turbulence model. Coastal Engineering. 2004; 51: 53-80. Ref.: https://goo.gl/D2uedD
- Dalrymple RA, Rogers BD. Numerical modeling of water waves with the SPH method. Coastal Engineering. 2006; 53: 141-147. Ref.: https://goo.gl/r2BEL3
- Shao S, Ji C. SPH computation of plunging waves using a 2-D sub-particle scale (SPS) turbulence model. Int J Numerical Methedos in Fluids. 2006; 51: 913-936. Ref.: https://goo.gl/4ZEwGZ
- Viccione G, Bovolin V, Pugliese Carratelli E. Simulating fluid-structure interaction with SPH. AIP Conference Proceedings. 2012; 1479: 209-212. Ref.: https://goo.gl/6RXsOr
- Ting FCK, Kirby JT. Dynamics of surf-zone turbulence in a strong plunging breaker. Coastal Engineering. 1995; 24: 177-204. Ref.: https://goo.gl/pU4VZQ
- Ting FCK, Kirby JT. Dynamics of surf-zone turbulence in a spilling breaker. Coastal Engineering. 1996; 27: 131-160. Ref.: https://goo.gl/Okw33U
- De Serio, Mossa M. Experimental study on the hydrodynamics of regular breaking waves. Coastal Engineering. 2006; 53: 99-113. Ref.: https://goo.gl/O3AAWq
- Dentale F, Donnarumma G, Pugliese Carratelli E. Wave run up and reflection on tridimensional virtual breakwater. J Hydrogeol Hydrol Eng. 2012; 1: 1. Ref.: https://goo.gl/kuDmSL
- Dentale F, Donnarumma G, Pugliese Carratelli E. Simulation Of Flow Within Armour Blocks In A Breakwater. Journal of coastal research. 2014b; 30: 528-536. Ref.: https://goo.gl/YDy2mb
- Dentale F, Donnarumma G, Pugliese Carratelli E. Numerical wave interaction with tetrapods breakwater. International Journal of Naval Architecture and Ocean Engineering. 2014; 6: 800-812. Ref.: https://goo.gl/0g0BXQ
- Cavallaro L, Dentale F, Donnarumma G, Foti E, Musumeci RE, et al. Rubble mound breakwater overtopping estimation of the reliability of a 3D numerical simulation. Coastal Engineering Proceedings. 2012.
- De Padova D, Darlymple RA, Mossa M, Petrillo AF. An analysis of the artificial viscosity in the SPH method modelling a regular breaking wave. 2009; Coastlab 08, Bari, Italy.
- Kirkgöz MS. Breaking wave impact on vertical and sloping coastal structures. Ocean Engineering. 1995; 22: 35-48. Ref.: https://goo.gl/03nwwC
- Peregrine DH. Water wave impact on walls. Annual Review of Fluid Mechanics. 2003; 35: 23-43. Ref.: https://goo.gl/gYG9A7
- Lugni C, Brocchini M, Faltinsen OM. Wave impact loads: The role of the flip-through. Physics Of Fluids. 2006; 18: 1-17. Ref.: https://goo.gl/kjnS2J
- Wienke J, Oumeraci H. Breaking wave impact force on a vertical and inclined slender pile-theoretical and large-scale model investigations. Coastal Engineering. 2005; 52: 435- 462. Ref.: https://goo.gl/TnKy0S